Open Access
Fig. 1.
Download original image
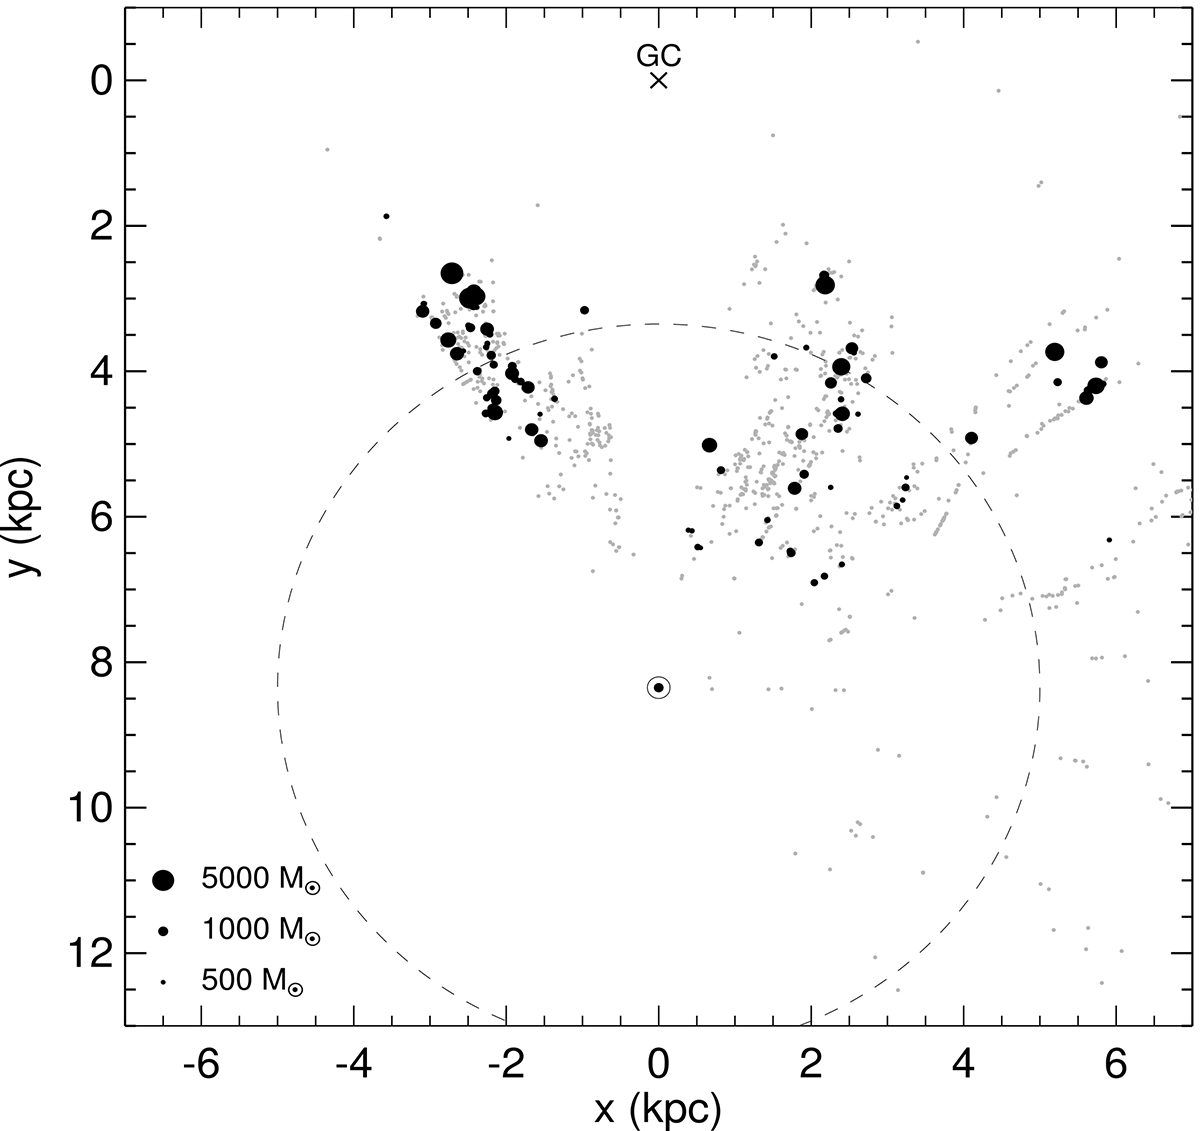
Source distribution for the regions in our ALMAGAL sub-sample is shown as black dots. The size of the markers scales with the masses of the ALMAGAL clumps. Grey dots are the rest of the ALMAGAL survey and the dashed line is a heliocentric distance circle at 5 kpc.
Current usage metrics show cumulative count of Article Views (full-text article views including HTML views, PDF and ePub downloads, according to the available data) and Abstracts Views on Vision4Press platform.
Data correspond to usage on the plateform after 2015. The current usage metrics is available 48-96 hours after online publication and is updated daily on week days.
Initial download of the metrics may take a while.