Fig. A.1
Download original image
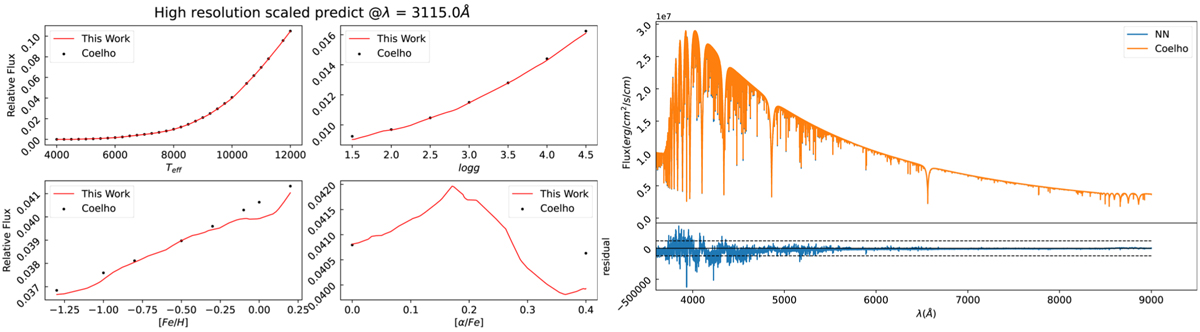
Left panel: Flux comparison between predicted (red curves) and theoretical values (black dots), at a random wavelength pixel for a typical MS star. Right panel: Comparison of predicted (blue) and theoretical spectra (orange). The residual spectrum is shown in the bottom right, where the ±3σ lines are indicated by the dotted lines. See the text for more details.
Current usage metrics show cumulative count of Article Views (full-text article views including HTML views, PDF and ePub downloads, according to the available data) and Abstracts Views on Vision4Press platform.
Data correspond to usage on the plateform after 2015. The current usage metrics is available 48-96 hours after online publication and is updated daily on week days.
Initial download of the metrics may take a while.