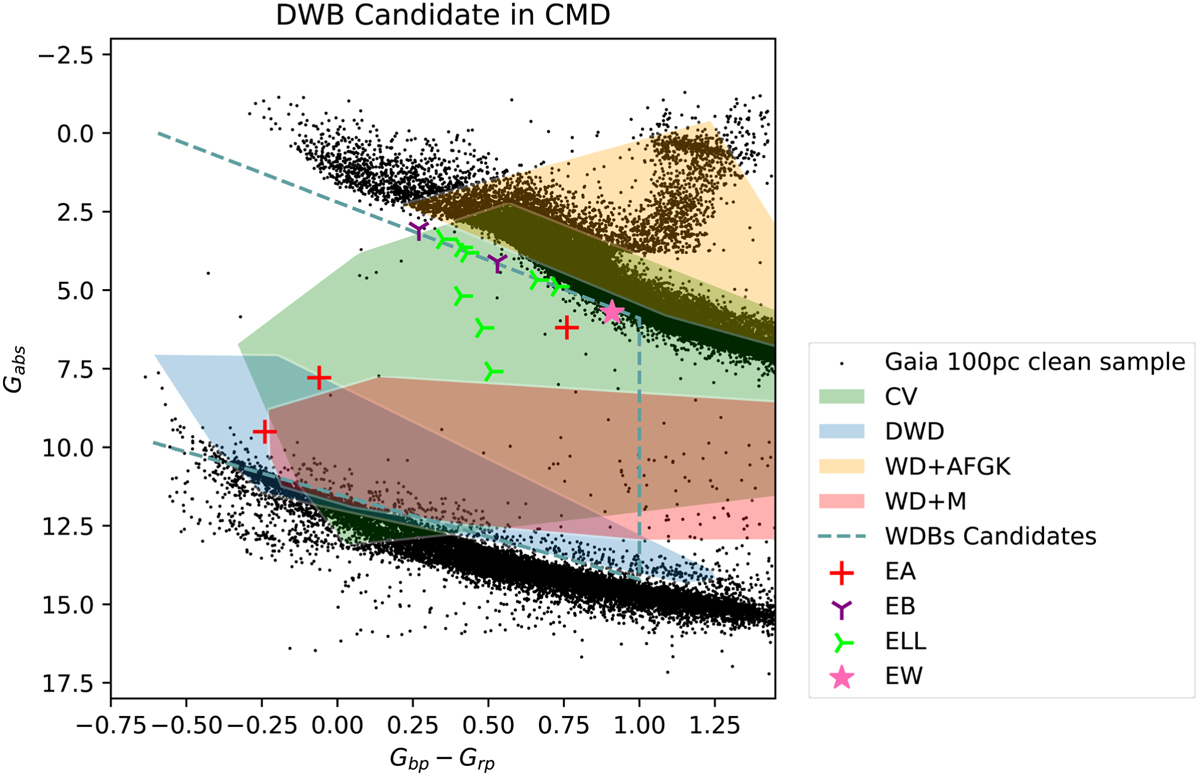
Fig. 5
Download original image
Our final samples on the Gaia CMD (colored symbols). Different types of binary systems identified by Ren et al. (2023) are denoted by different colored symbols. The black dots denote Gaia samples within 100 pc with small errors. The region outlined by cadet dashed blue lines was set by Ren et al. (2023) to select their candidates. The color-shaded regions indicate the locations of gold samples (CVs-green, DWDs-blue, WD+AFGK-orange, WD+M-red) compiled by Inight et al. (2021).
Current usage metrics show cumulative count of Article Views (full-text article views including HTML views, PDF and ePub downloads, according to the available data) and Abstracts Views on Vision4Press platform.
Data correspond to usage on the plateform after 2015. The current usage metrics is available 48-96 hours after online publication and is updated daily on week days.
Initial download of the metrics may take a while.