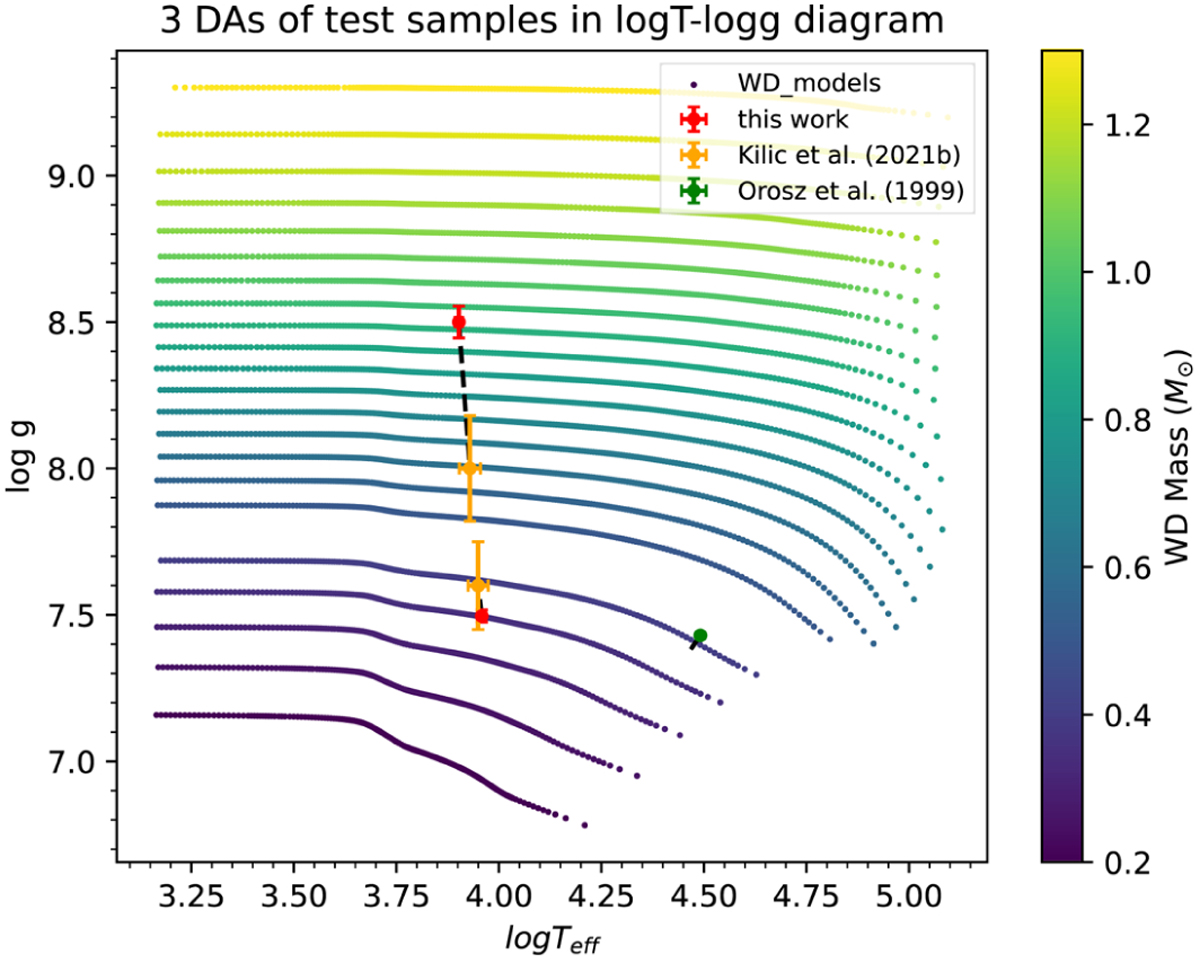
Fig. 3
Download original image
Kiel diagram of three DAs in the test sample. The evolutionary tracks provided by Cheng et al. (2020) are shown as small dots, where their masses are indicated by the color bar. The red symbols with error bars represent the expected values and uncertainties of our fitting results. Similarly, orange symbols and green symbols show the literature results of Kilic et al. (2021) and Orosz et al. (1999), respectively. Obviously, the error in log 𝑔 is propagated to the stellar mass, and thus the radius. As the surface gravity is expressed on a log scale, and the mass and radius are expressed on a linear scale, the mass-radius errors are magnified.
Current usage metrics show cumulative count of Article Views (full-text article views including HTML views, PDF and ePub downloads, according to the available data) and Abstracts Views on Vision4Press platform.
Data correspond to usage on the plateform after 2015. The current usage metrics is available 48-96 hours after online publication and is updated daily on week days.
Initial download of the metrics may take a while.