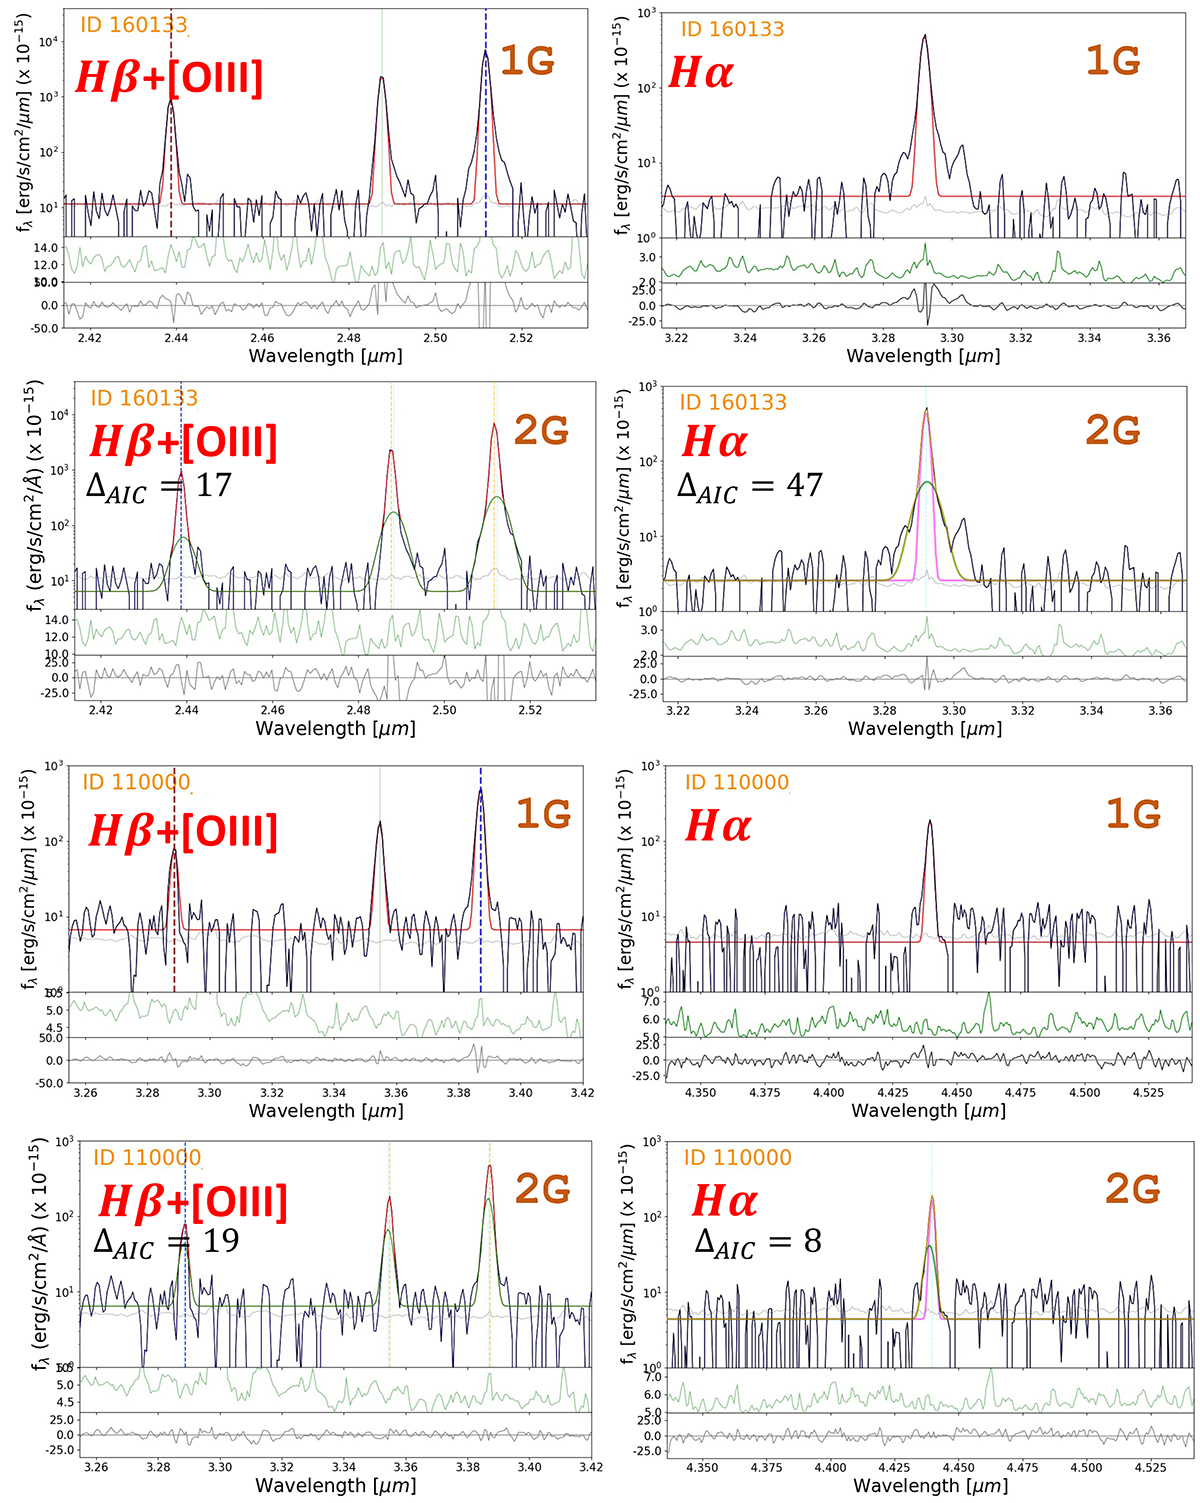
Fig. 7.
Download original image
Single Gaussian (1G) and double Gaussian (2G, narrow + broad) best fits to the [O III] λ5007 Å+Hβ and Hα lines, as indicated in each panel label, for the two galaxies (ID GLASS 160133 and 110000) in which we detect a significant outflow signature in both emission lines (upper and lower four panels, respectively). In each panel, the upper part shows the observed spectrum with the best fit line in red (red (green) line for the narrow (broad) component in the double Gaussian fit), the middle part represents the error spectrum, while the bottom part is the residual after subtracting the best fit result. The spectra are in the observed frame wavelength.
Current usage metrics show cumulative count of Article Views (full-text article views including HTML views, PDF and ePub downloads, according to the available data) and Abstracts Views on Vision4Press platform.
Data correspond to usage on the plateform after 2015. The current usage metrics is available 48-96 hours after online publication and is updated daily on week days.
Initial download of the metrics may take a while.