Fig. 6.
Download original image
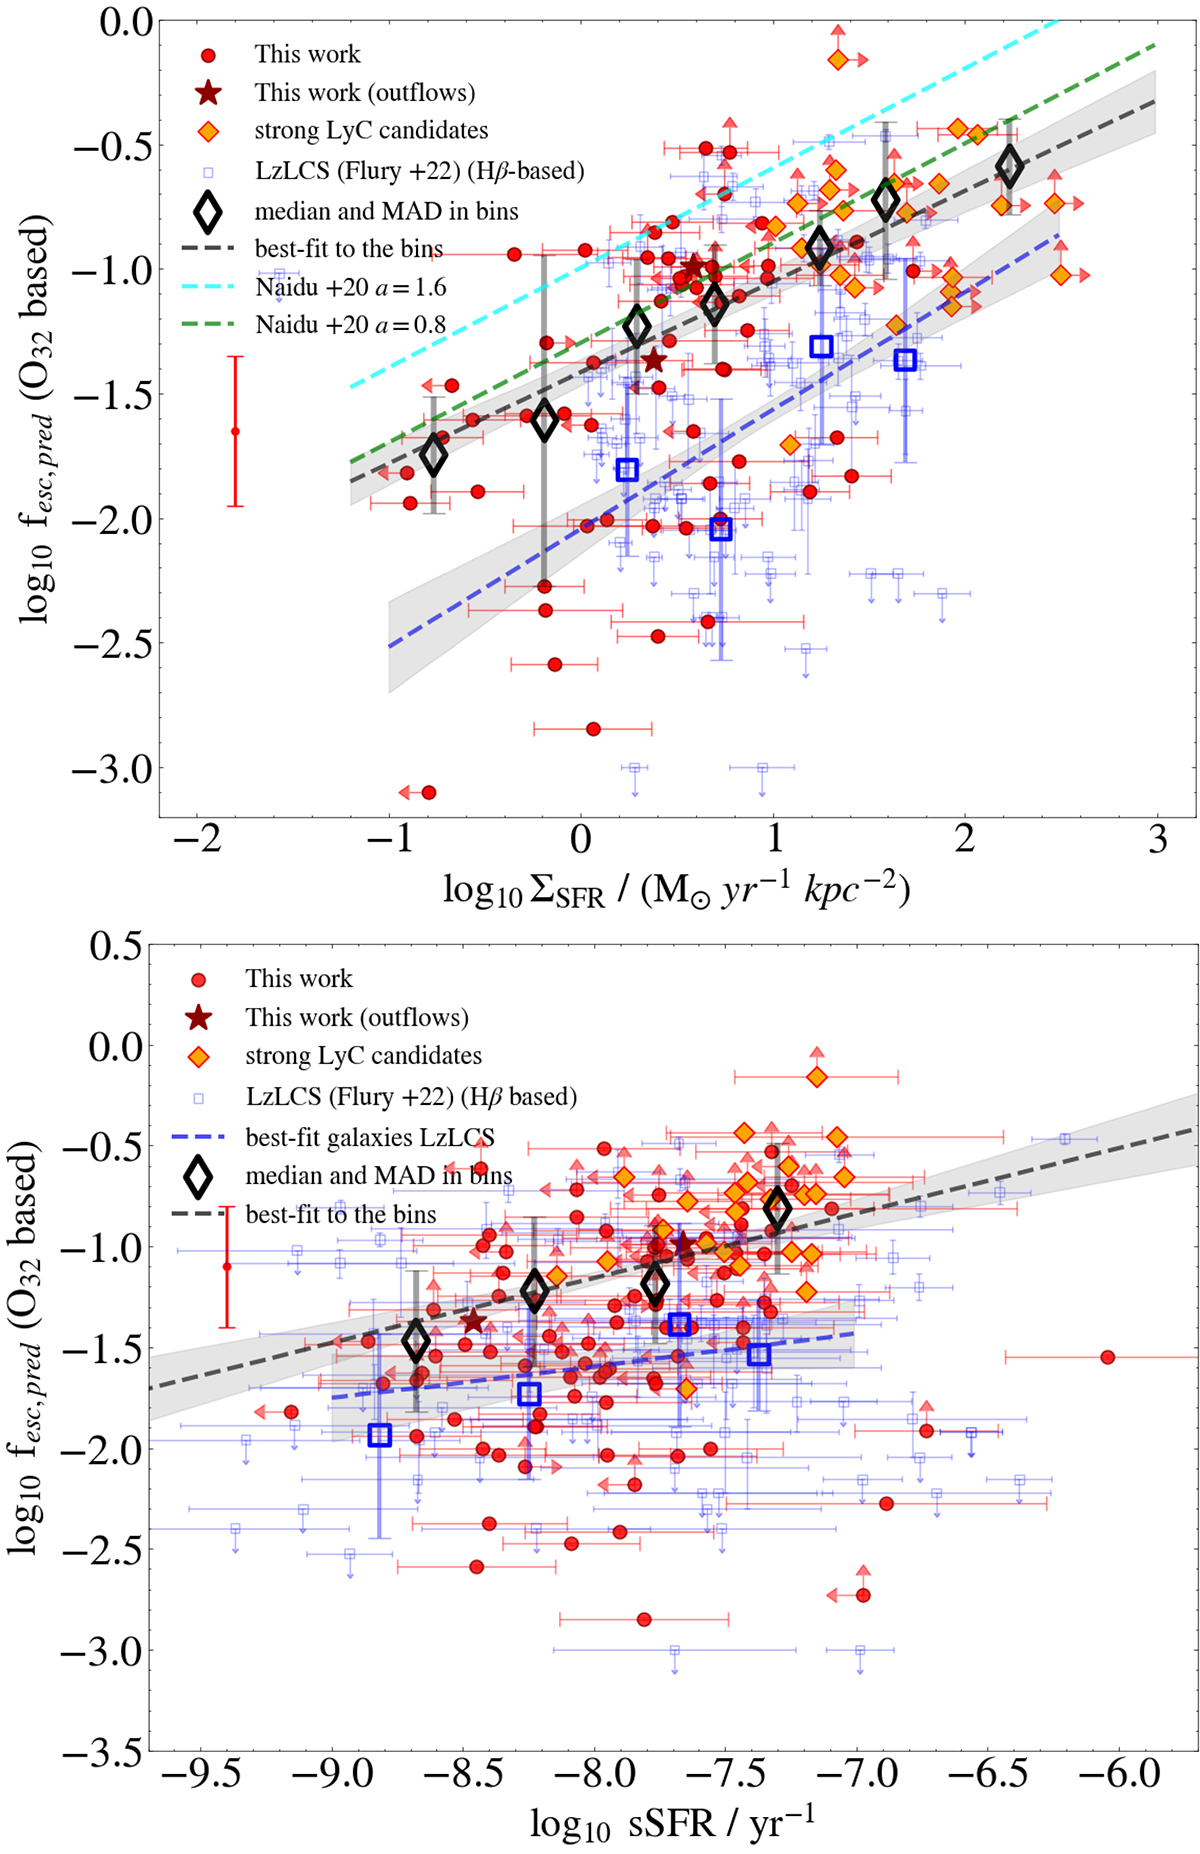
Diagram comparing ΣSFR and fesc for galaxies at 4 < z < 10 with an estimate of fesc(top). The lines, shaded areas, and markers are the same as in Fig. 2. sSFR versus fesc for this NIRSpec sample is shown in the bottom panel. The orange diamonds represent strong LyC leaking candidates according to Flury et al. (2022), as highlighted in Fig. 5. The two galaxies for which we detect outflow signatures in their H-grating spectra from GLASS are shown as big darkred stars. The sample representative error of 0.3 dex on fesc is added below the legend. We include with blue empty squares the LzLCS sample of 66 galaxies at 0.2 < z < 0.4, with measurements (including direct estimates of fesc) performed by Flury et al. (2022).
Current usage metrics show cumulative count of Article Views (full-text article views including HTML views, PDF and ePub downloads, according to the available data) and Abstracts Views on Vision4Press platform.
Data correspond to usage on the plateform after 2015. The current usage metrics is available 48-96 hours after online publication and is updated daily on week days.
Initial download of the metrics may take a while.