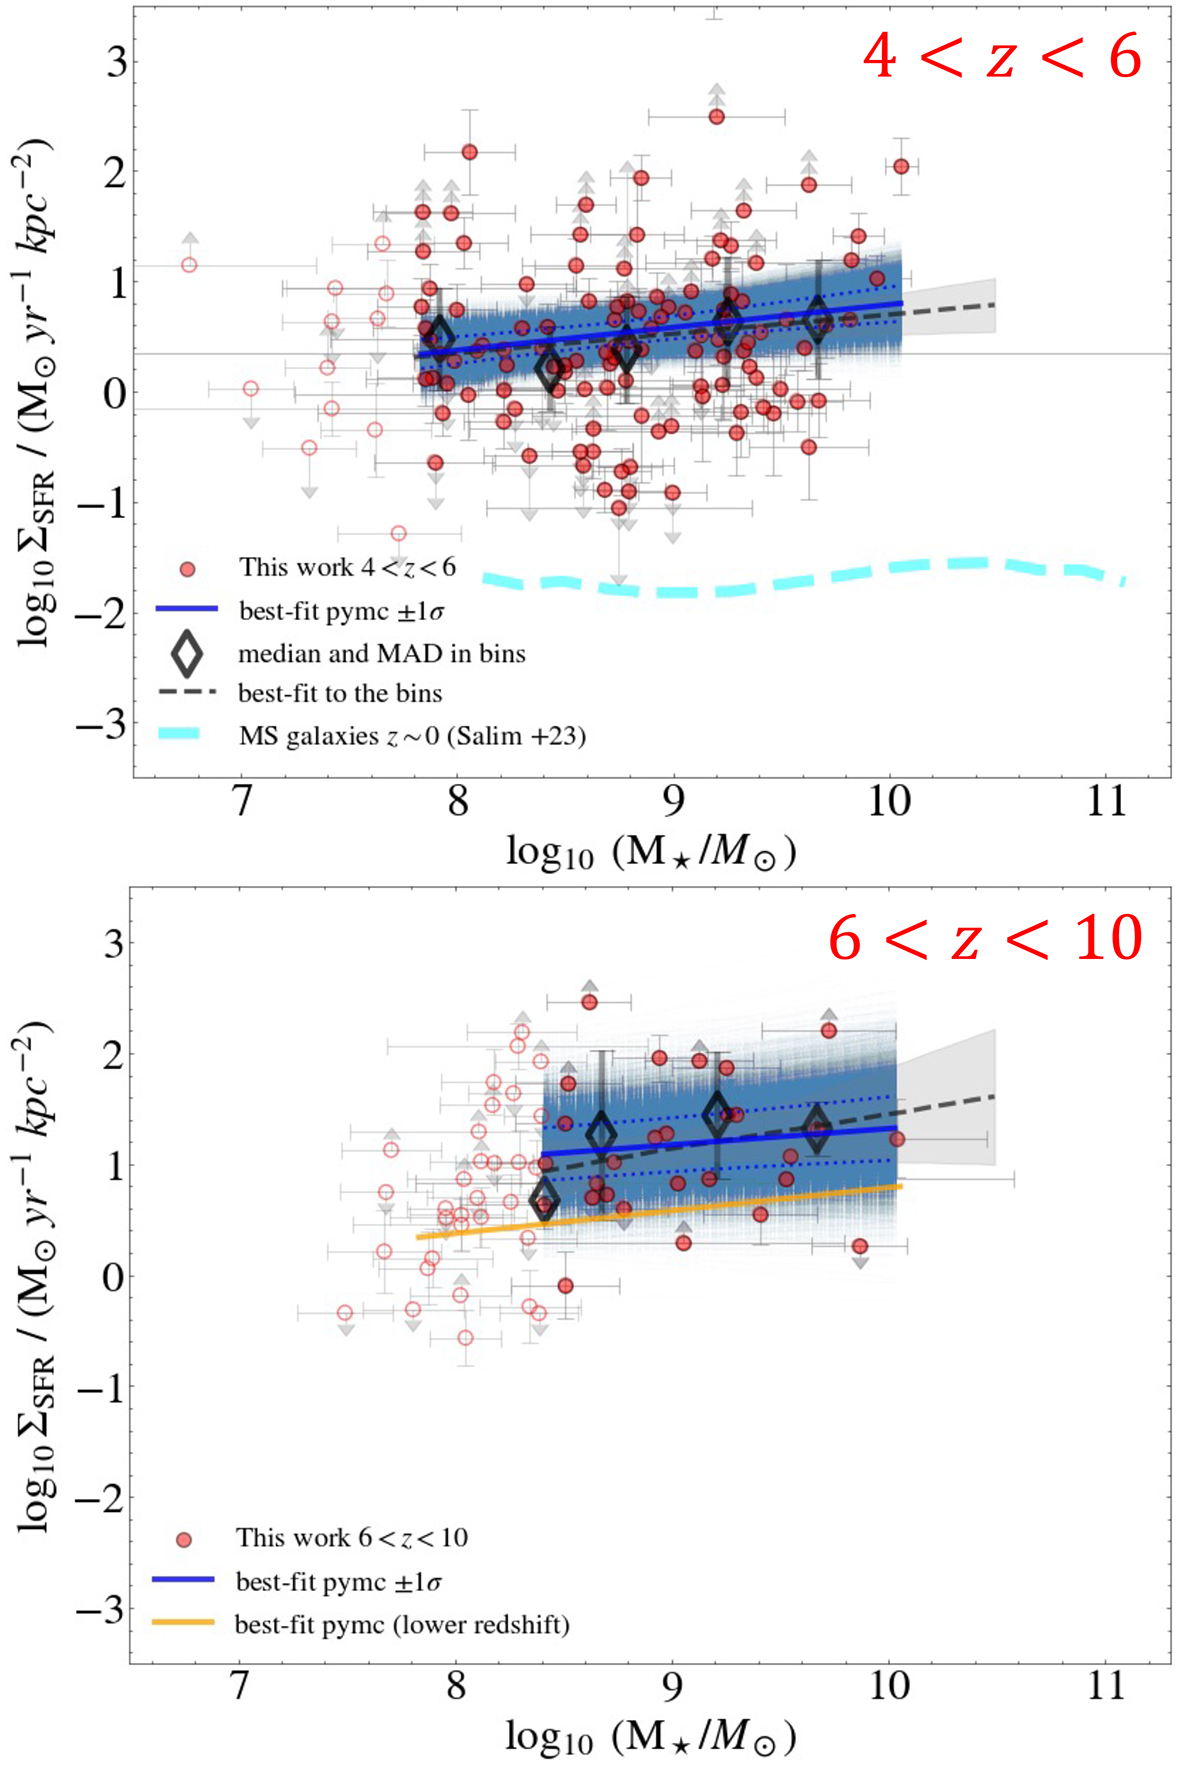
Fig. 4.
Download original image
ΣSFR main sequence for our selected galaxies in the lower redshift bin (4 < z < 6, top) and higher redshift bin (6 < z < 10, bottom). The lines, shaded areas, and markers are the same as in Fig. 2. The average location of massive (M⋆ > 109 M⊙) star-forming galaxies at redshift ∼0 presented by Salim et al. (2023) is highlighted with a cyan dashed line.
Current usage metrics show cumulative count of Article Views (full-text article views including HTML views, PDF and ePub downloads, according to the available data) and Abstracts Views on Vision4Press platform.
Data correspond to usage on the plateform after 2015. The current usage metrics is available 48-96 hours after online publication and is updated daily on week days.
Initial download of the metrics may take a while.