Fig. 3.
Download original image
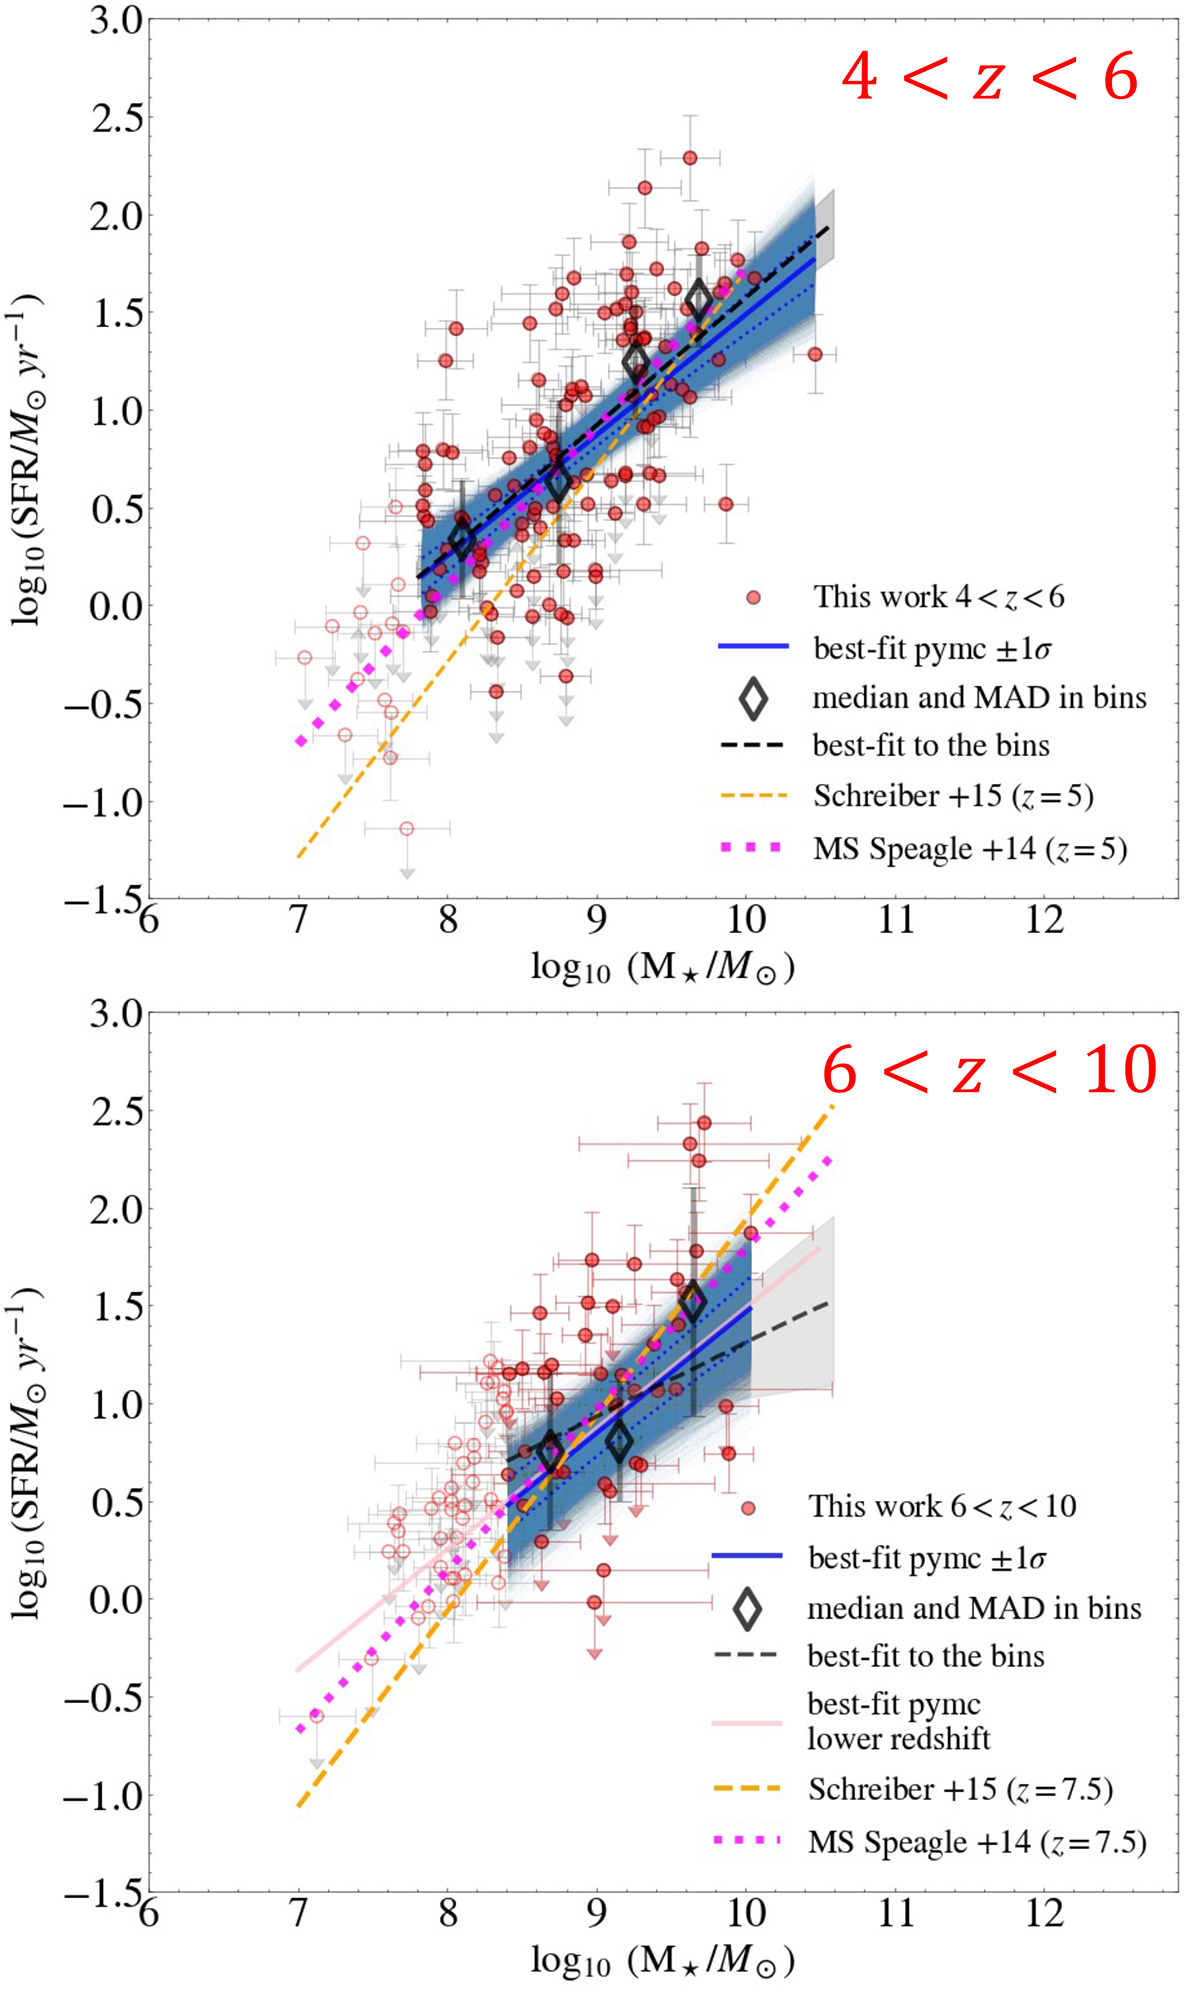
Star-forming main sequence of galaxies selected in this work in the redshift range 4 < z < 6. The best-fit relations are derived in the mass range where we have 90% mass completeness. For comparison, the high redshift and low-mass extrapolation of the MS relations by Schreiber et al. (2015) and Speagle et al. (2014) (obtained at lower redshifts and higher M⋆) are shown with dashed orange and dotted fuchsia lines, respectively. Bottom panel shows the same as the top, but for the redshift range 6 < z < 10. The Bayesian best-fit relation obtained in the lower redshift bin in included as a pink continuous line for comparison.
Current usage metrics show cumulative count of Article Views (full-text article views including HTML views, PDF and ePub downloads, according to the available data) and Abstracts Views on Vision4Press platform.
Data correspond to usage on the plateform after 2015. The current usage metrics is available 48-96 hours after online publication and is updated daily on week days.
Initial download of the metrics may take a while.