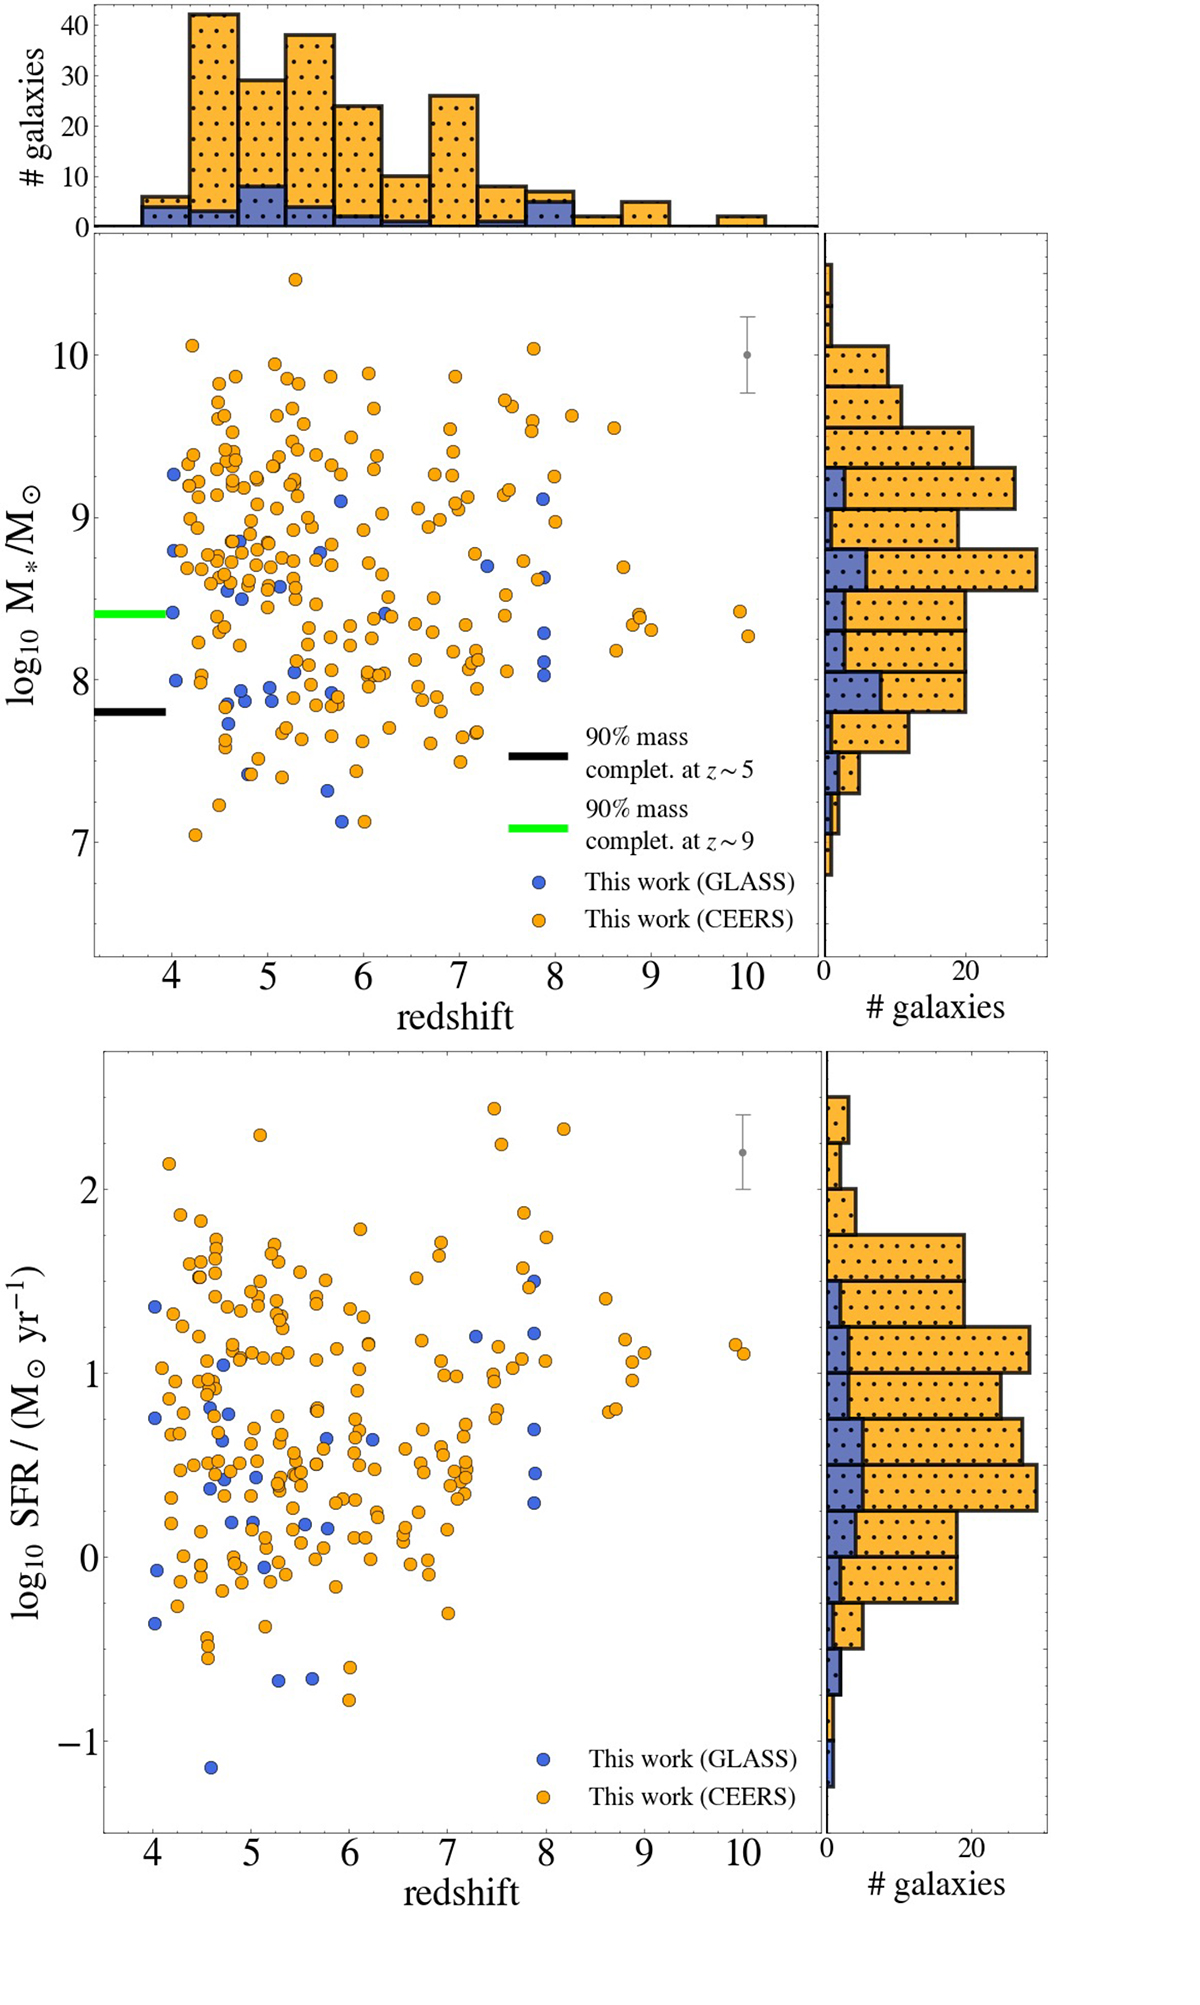
Fig. 1.
Download original image
Redshift distribution of stellar masses (top panel) and SFRs (bottom panel) for the galaxies selected in this paper. We highlight the redshift histogram of the entire sample on top of the first diagram, while the M⋆ and SFRs histograms are added on the right part of each panel. Galaxies coming from the CEERS and GLASS surveys are differentiated with a yellow and blue color, respectively. We note that GLASS probes galaxies with slightly lower masses and SFRs on average, thanks to the gravitational lensing magnification effect. The gray vertical bars in the top right corners represent the typical uncertainties (∼0.2 dex) for the stellar masses and SFRs. The 90% mass completeness limits at z ∼ 5 and z ∼ 9 are highlighted, respectively, with black and lime horizontal segments.
Current usage metrics show cumulative count of Article Views (full-text article views including HTML views, PDF and ePub downloads, according to the available data) and Abstracts Views on Vision4Press platform.
Data correspond to usage on the plateform after 2015. The current usage metrics is available 48-96 hours after online publication and is updated daily on week days.
Initial download of the metrics may take a while.