Open Access
Fig. 4
Download original image
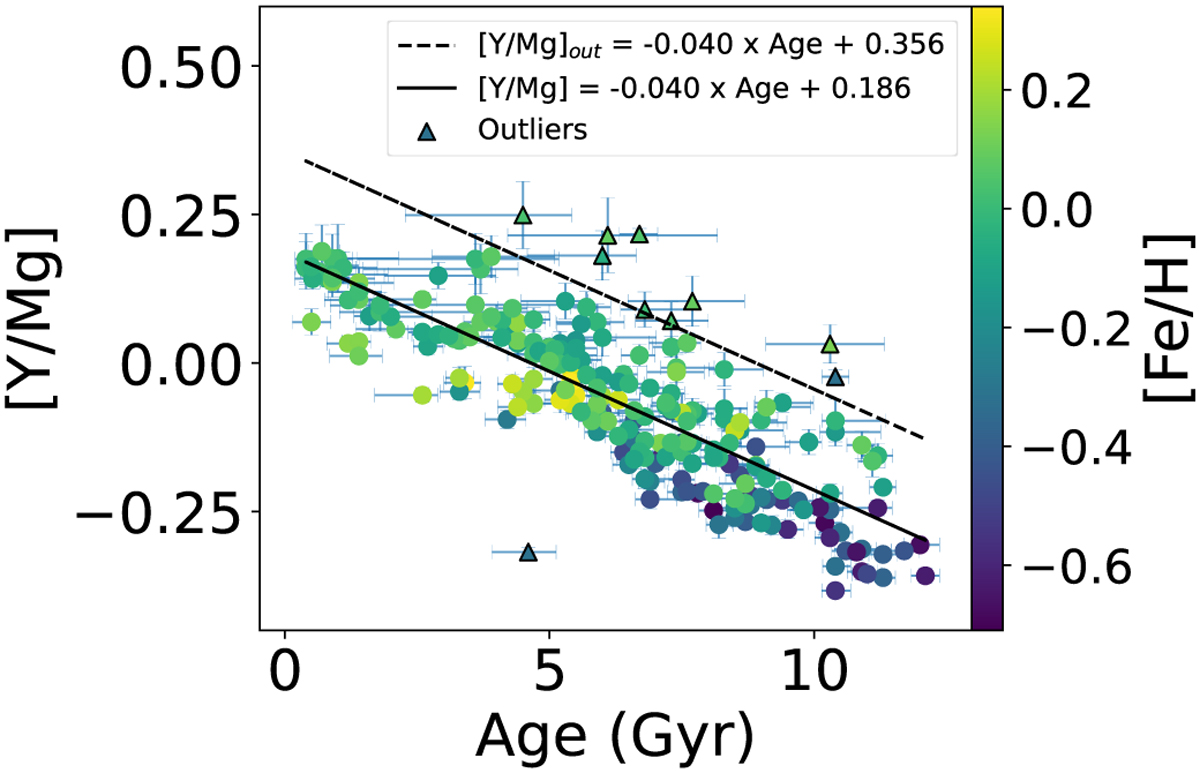
Linear fit to the [Y/Mg]-age distribution of the whole sample (solid black line) and the outlier cut (dashed black line). The outlier limit is set at the 2σ level of the trend. The triangle in the lower part of the plot is the anomalous star HD 65907.
Current usage metrics show cumulative count of Article Views (full-text article views including HTML views, PDF and ePub downloads, according to the available data) and Abstracts Views on Vision4Press platform.
Data correspond to usage on the plateform after 2015. The current usage metrics is available 48-96 hours after online publication and is updated daily on week days.
Initial download of the metrics may take a while.