Fig. F.2
Download original image
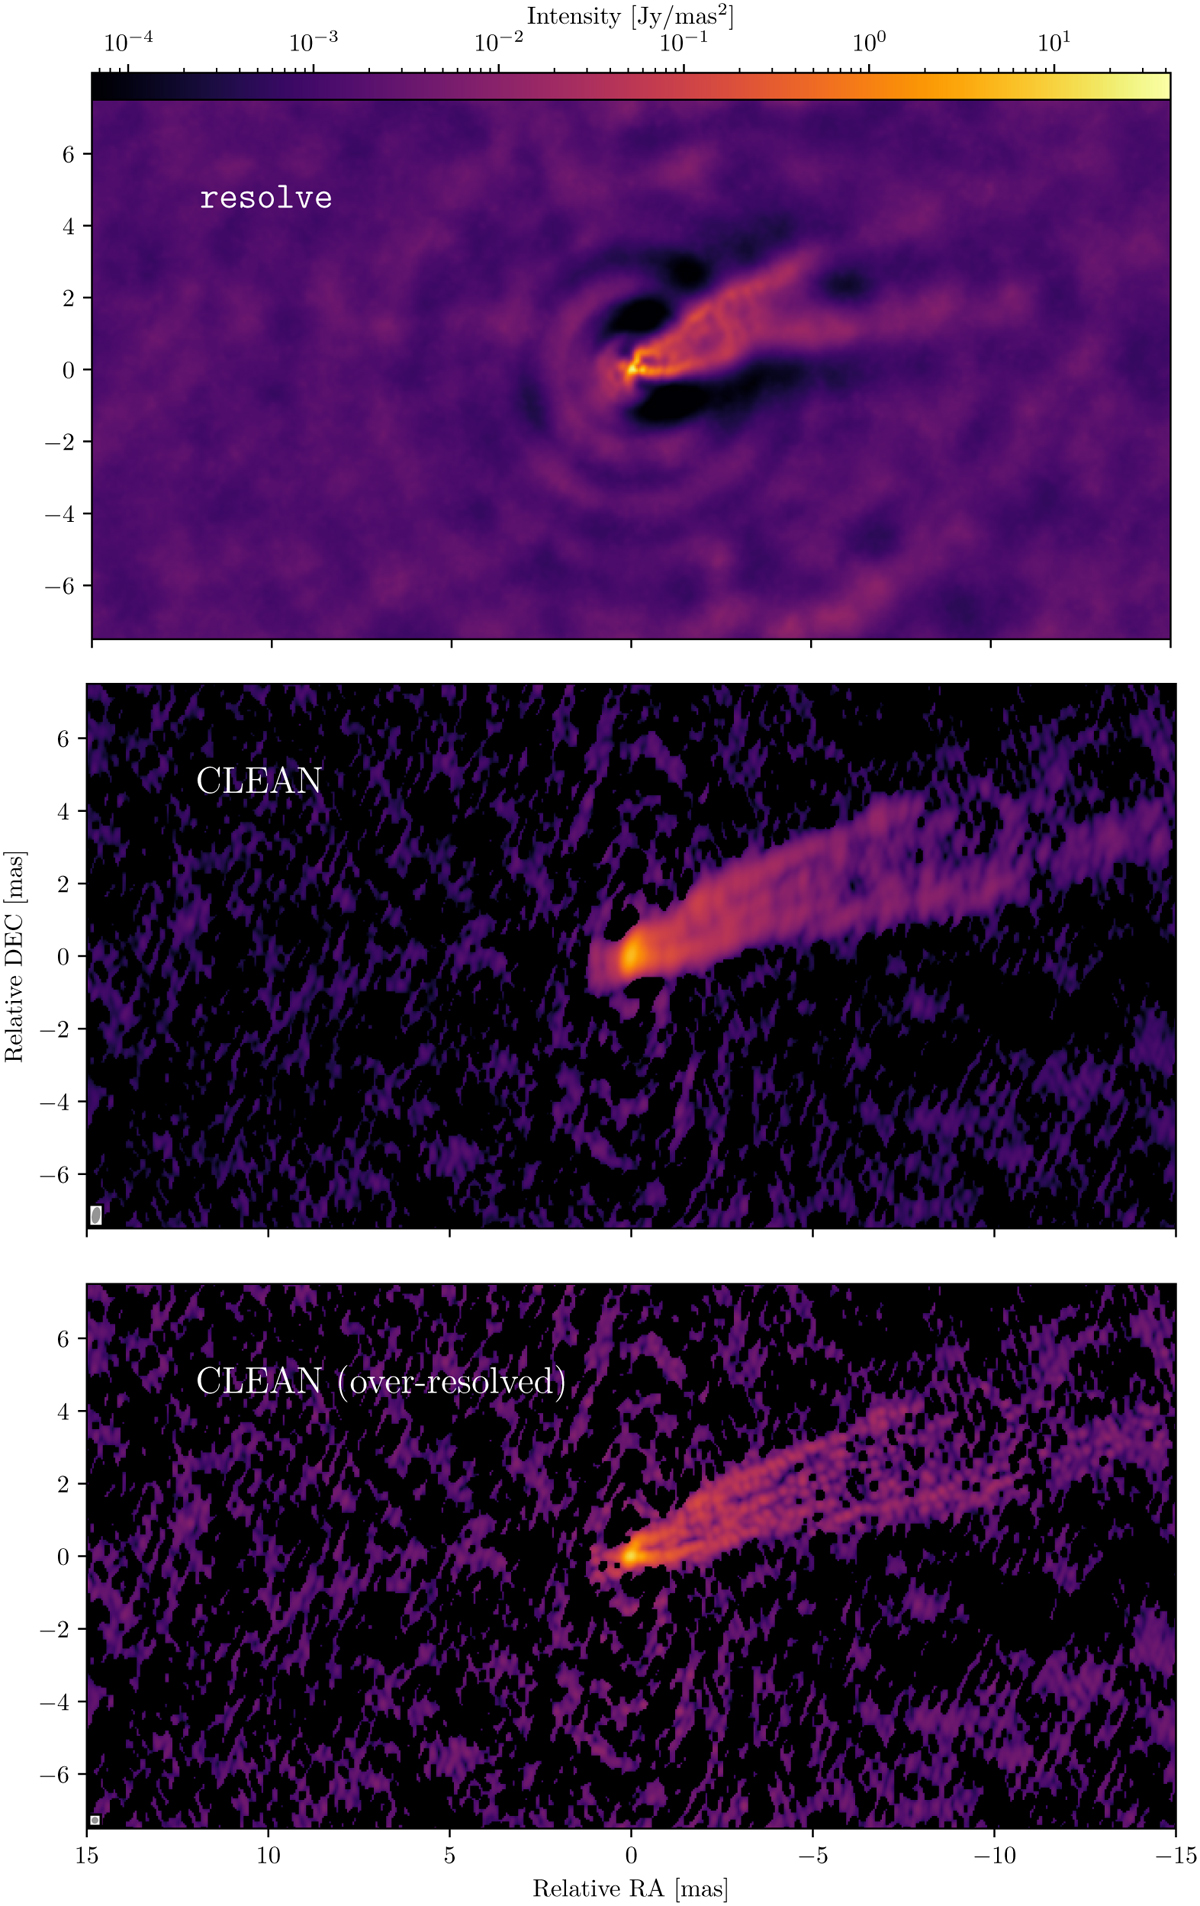
M87: the posterior mean image by Bayesian self-calibration (top), the self-calibrated CLEAN image (middle) and the over-resolved CLEAN image (bottom) reconstructed from the same a-priori calibrated visibility data of VLBA observations at 43 GHz. The unified color bar shows an intensity range from the minimum intensity up to the maximum intensity of the resolve image. The image obtained by the Bayesian approach has a maximum intensity Imax = 35 Jy mas−2 with a minimum value of Imin = 8 µJy mas−2. The CLEAN image (middle) restoring beam shown in the lower-left corner of the plot is 0.5 × 0.2 mas, P.A. = −11°. The maximum intensity of the CLEAN reconstruction is Imax = 6 Jy mas−2. The over-resolved CLEAN image (bottom) circular restoring beam shown in the lower-left corner of the plot is 0.18 mas. The maximum intensity of the over-resolved CLEAN image is Ipeak = 13 Jy mas−2.
Current usage metrics show cumulative count of Article Views (full-text article views including HTML views, PDF and ePub downloads, according to the available data) and Abstracts Views on Vision4Press platform.
Data correspond to usage on the plateform after 2015. The current usage metrics is available 48-96 hours after online publication and is updated daily on week days.
Initial download of the metrics may take a while.