Fig. F.1
Download original image
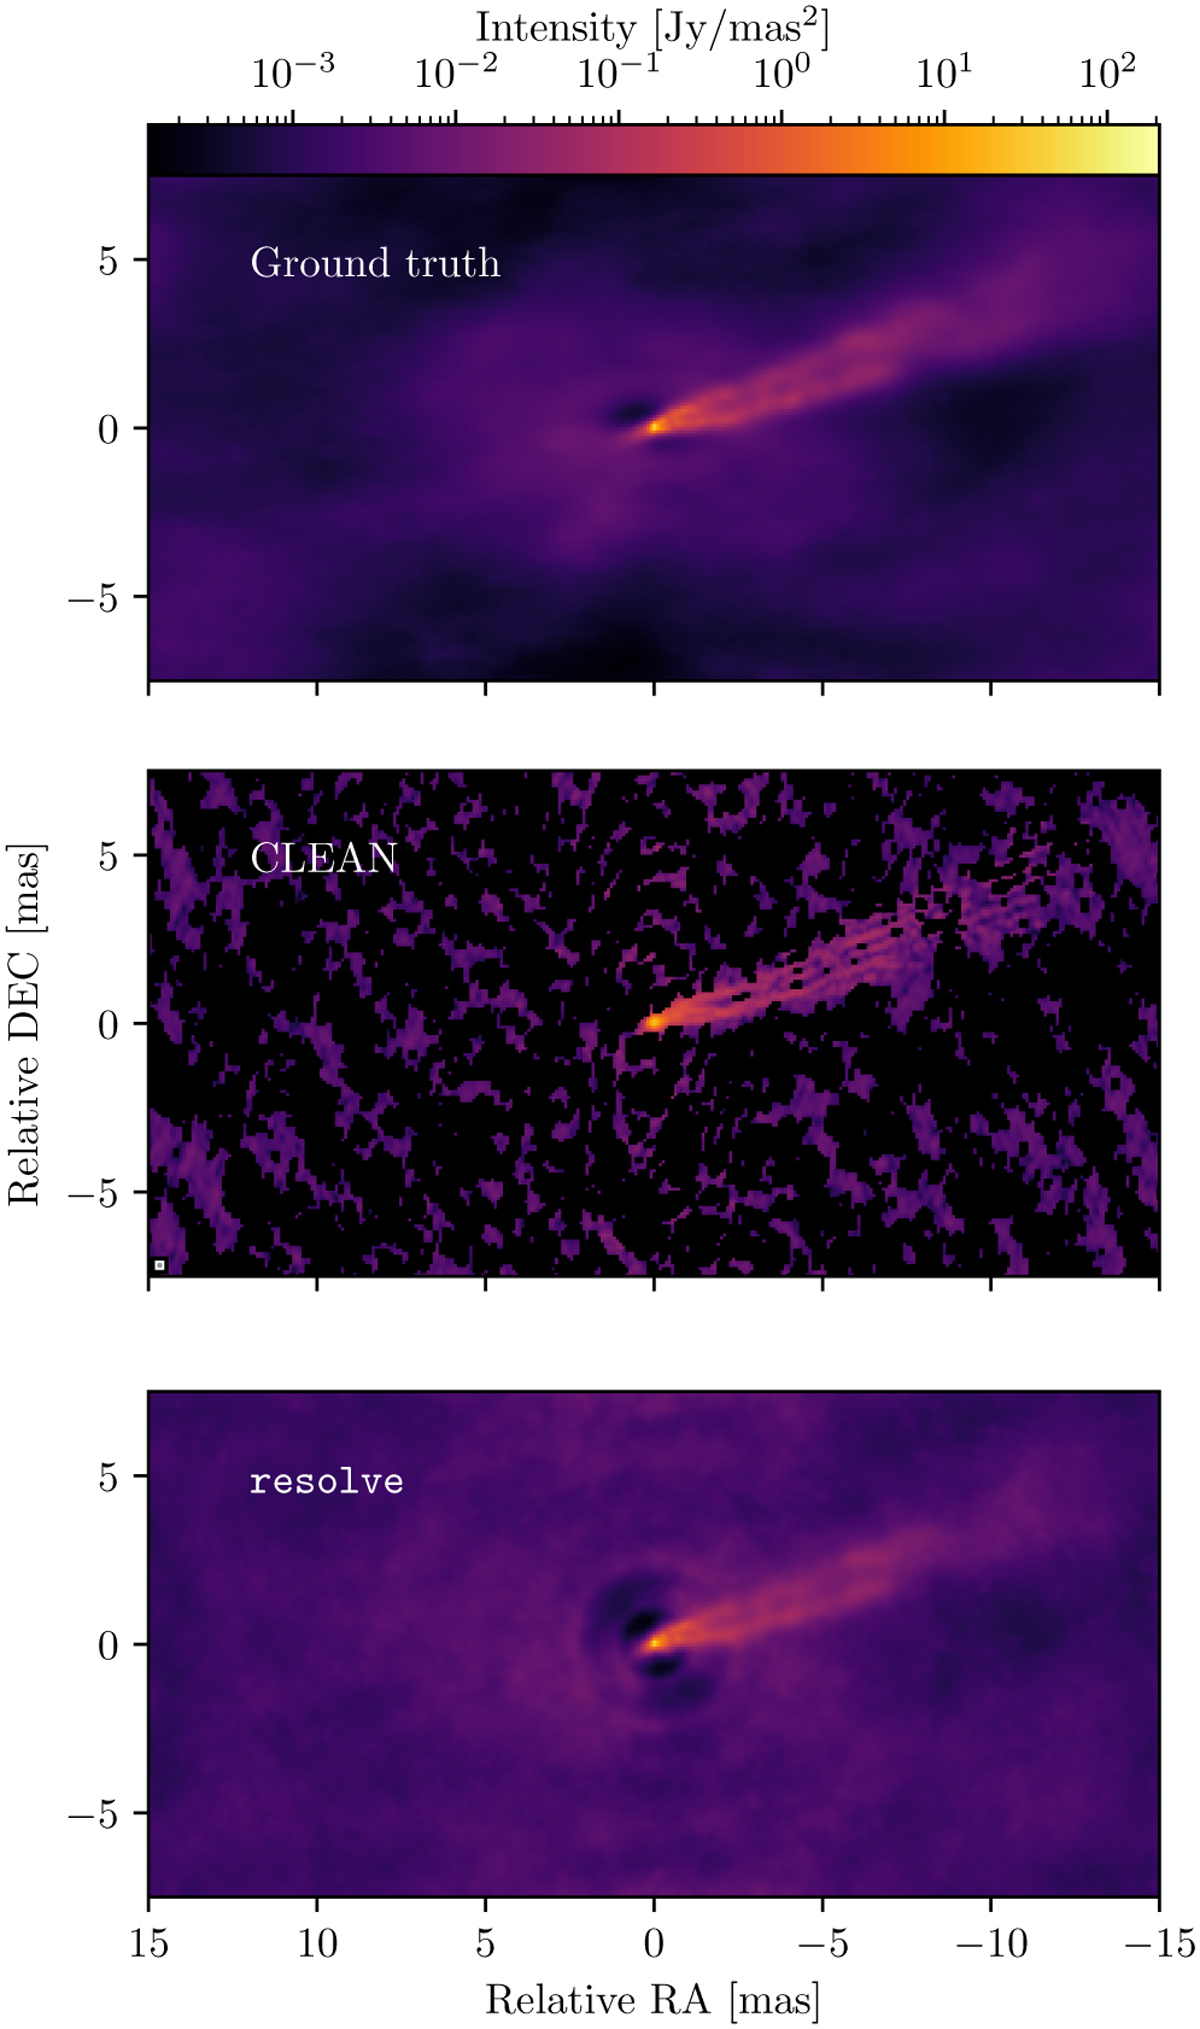
Synthetic data: ground truth (top) and reconstructed images obtained using CLEAN (middle) and resolve (bottom) self-calibration. The circular 0.15 mas CLEAN beam is illustrated in the bottom left corner of the plot. The CLEAN image was masked at the lowest positive value. The unified color bar on the top of the figure shows an intensity range of the ground truth image, where maximum intensity is ![]() , the minimum value is
, the minimum value is ![]() . Maximum intensity values of reconstructed images are
. Maximum intensity values of reconstructed images are ![]() correspondingly.
correspondingly.
Current usage metrics show cumulative count of Article Views (full-text article views including HTML views, PDF and ePub downloads, according to the available data) and Abstracts Views on Vision4Press platform.
Data correspond to usage on the plateform after 2015. The current usage metrics is available 48-96 hours after online publication and is updated daily on week days.
Initial download of the metrics may take a while.