| Issue |
A&A
Volume 690, October 2024
|
|
|---|---|---|
| Article Number | A330 | |
| Number of page(s) | 9 | |
| Section | Galactic structure, stellar clusters and populations | |
| DOI | https://doi.org/10.1051/0004-6361/202449473 | |
| Published online | 18 October 2024 | |
Multiwavelength identification of millisecond pulsar candidates in the Galactic bulge
1
LAPTh, CNRS, USMB, 74940
Annecy, France
2
Université Grenoble Alpes, CNRS, IPAG, 38000
Grenoble, France
3
University of Maryland, Department of Astronomy, College Park, MD, 20742
USA
4
NASA Goddard Space Flight Center, Code 662, Greenbelt, MD, 20771
USA
5
National Radio Astronomy Observatory, PO Box O
Socorro, NM, 87801
USA
6
Dept. of Engineering & Physics, Sweet Briar College, Sweet Briar, VA, 24595
USA
7
Space Science Division, US Naval Research Laboratory, Washington, DC, 20375
USA
Received:
2
February
2024
Accepted:
22
March
2024
Abstract
Context. The existence of a population of millisecond pulsars in the Galactic bulge is supported, along with other evidence, by the Fermi GeV excess, an anomalous γ-ray emission detected almost 15 years ago in the direction of the Galactic center. However, radio surveys searching for pulsations have not yet revealed bulge millisecond pulsars.
Aims. Identifying promising bulge millisecond pulsar candidates is key to motivating pointed radio pulsation searches. Candidates are often selected among steep-spectrum or polarized radio sources, but multiwavelength information can also be exploited: The aim of this work is to pinpoint strong candidates among the yet unidentified X-ray sources.
Methods. We investigated the multiwavelength counterparts of sources detected by the Chandra X-ray observatory that have spectral properties expected for millisecond pulsars in the Galactic bulge. We considered that ultraviolet, optical, and strong infrared counterparts indicate that an X-ray source is not a bulge pulsar, while a radio or a faint infrared counterpart makes it a promising candidate.
Results. We identify a large population of more than a thousand X-ray sources without optical, ultraviolet, or strong infrared counterparts. Among them, five are seen for the first time in unpublished radio imaging data from the Very Large Array. We provide the list of promising candidates, for most of which follow-up pulsation searches are ongoing.
Key words: pulsars: general / Galaxy: bulge / radio continuum: stars / X-rays: stars
Corresponding author; This email address is being protected from spambots. You need JavaScript enabled to view it.
© The Authors 2024
 Open Access article, published by EDP Sciences, under the terms of the Creative Commons Attribution License (https://creativecommons.org/licenses/by/4.0), which permits unrestricted use, distribution, and reproduction in any medium, provided the original work is properly cited.
This article is published in open access under the Subscribe to Open model. This email address is being protected from spambots. You need JavaScript enabled to view it. to support open access publication.
1. Introduction
Among the zoology of objects in our Galaxy, pulsars stand out as peculiar sources. These highly magnetized and fast rotating neutron stars are characterized by a very stable pulsed emission, which enables a sure identification. They are multiwavelength emitters, notably in γ rays (see e.g., Abdo et al. 2013; Smith et al. 2023), X rays (see e.g., Lee et al. 2018; Coti Zelati et al. 2020), and radio (see e.g., Manchester et al. 2005).
Pulsars are fantastic probes in many physics domains. The dispersion observed in their pulsed radio emission informs us about the properties of the interstellar medium and is used to create models of the Galactic density of free electrons (see e.g., Yao et al. 2017). Simultaneous measurements of the mass and radius of pulsars provide constraints on the equation of state of cold dense matter (see e.g., Yunes et al. 2022). Pulsars are also unique laboratories for studying physics and testing theories of gravity in extreme conditions (see, e.g., Psaltis et al. 2016; Torne et al. 2023; Wex & Kopeikin 1999; Kramer et al. 2021 for pulsars in binary systems). Recently, pulsar timing arrays have provided evidence for a stochastic gravitational wave background (Agazie et al. 2023; EPTA Collaboration 2023; Reardon et al. 2023; Xu et al. 2023).
The majority of the known pulsar population is local and found within a few kiloparsecs of Earth. Very little is known about the pulsar population toward the Galactic center (GC), making this region, especially the one around the supermassive black hole Sgr A*, a very interesting place to search for new pulsars. Indeed, the GC is a massive-star formation site (Figer 2009), harboring neutron star progenitors, some pulsar wind nebulae candidates (Muno et al. 2008), numerous point-like X-ray sources (Muno et al. 2009), and dense cusps of X-ray binaries, possibly including millisecond pulsars (MSPs), that is, pulsars with rotation periods < 30 ms (Hailey et al. 2018; Mori et al. 2021). Moreover, theoretical studies and multiwavelength observations suggest that a large population of pulsars exists in the vicinity of Sgr A*, as well as on larger scales (Pfahl & Loeb 2004). The unexplained, spatially extended, diffuse γ-ray emission detected by the Fermi-LAT, the so-called Fermi GeV excess, can be interpreted as the cumulative emission from a population of MSPs, too faint to be detected as individual γ-ray sources and with number density strongly peaked at the GC (for a review, see Murgia 2020 and references therein). An alternative, compelling, hypothesis claims that the Fermi GeV excess is caused by dark-matter annihilation in the GC. Therefore, discovering MSPs in the Galactic bulge can also help to constrain the contribution of dark matter to the excess and its properties. Recent independent γ-ray analyses have confirmed an at least partial stellar origin of the Fermi GeV excess, strengthening the case for the existence of an abundant population of MSPs in the Galactic bulge (Calore et al. 2021; List et al. 2020, 2021; Mishra-Sharma & Cranmer 2022).
It has been shown that current radio timing surveys are not sensitive enough to unveil the bulge MSP population (Calore et al. 2016). Deep targeted observations are therefore needed. Pulsar candidates are usually selected among steep-spectrum (index α < −2) and/or highly polarized radio sources (see, e.g. Kaplan et al. 2019; Hyman et al. 2019; Sobey et al. 2022). Indeed, pulsars are part of the sources with the steepest radio indices (Kaplan et al. 2000) and the highest circular polarization fraction (Lenc et al. 2018). Nonetheless, the mean radio index of MSPs is −1.77 ± 0.741 and high circular polarization is not universal among pulsars (Han et al. 1998). Thereby, standard MSP candidate identification methods focus on a peculiar part of the whole population.
Berteaud et al. (2021) simulated the Galactic population of disk and bulge MSPs, together with their γ- and X-ray emissions, assuming the bulge component to be the only thing responsible for the Fermi GeV excess. This study has assessed the sensitivity of existing X-ray telescopes to this population for the first time and demonstrates that about a hundred bulge MSPs could have been detected in past observations of the Chandra X-ray Observatory in our region of interest (ROI; |l|,|b|< 3°), while the contamination from disk MSPs is negligible. Berteaud et al. (2021) conservatively selected 3158 bulge MSP candidates2 among sources in the second release of the Chandra source catalog (Evans et al. 2010), according to their X-ray spectral behavior and their distance, excluding (too) soft sources and those either too close or too far to be in the bulge. Their positions are shown in Fig. 1. The large number of MSP candidates compared to the expected number of detections does not allow us to rule out the MSP interpretation of the Fermi GeV excess and motivates further investigations.
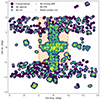 |
Fig. 1. Positions of MSP candidates after successive selections: conservative selection of Berteaud et al. (2021) (dark blue) after removing those with optical (Sect. 3.1, blue), UV (Sect. 3.2, teal), strong NIR (Sect. 3.3.2, green), and FIR (Sect. 3.3.4, yellow) counterparts. Some of these sources have a potential VLA (radio) counterpart and/or are compact-object (CO) candidates (red crosses). Sources from the conservative selection of Berteaud et al. (2021) for which we found an optical counterpart therefore appear as single dark blue circles; those without an optical counterpart but with a UV one appear as a blue circle with a dark blue ring, etc. The shaded region shows the approximate coverage of the VLA mosaic (orange). The spatial distribution of the candidates is correlated with the sensitivity threshold of Chandra. |
The classification of X-ray sources through multiwavelength counterparts is an active field of research (see, e.g., Tranin et al. 2022), but it often does not include a proper category for pulsars. In this paper, we present a novel method for the identification of (millisecond-)pulsar candidates from multiwavelength data (starting from the X rays) free from standard polarization and radio spectral index criteria. Our goal is to highlight a small subset of sources that is promising enough for follow-up studies. To this end, we exploited the typical multiwavelength pulsar emission.
In Sect. 2, we describe the catalogs and observations that we used to associate our X-ray MSP candidates with their potential counterparts and how we did the associations. Section 3 presents our results and highlights the candidates that we selected for follow-up observations. Finally, in Sect. 4, we summarize our results and discuss our method and future prospects.
2. Cross-matches: Catalogs and observations
To investigate the multiwavelength counterparts of the Chandra MSP candidates, we used published catalogs in the optical, ultraviolet (UV), infrared (IR), and radio, as well as radio observations obtained with the Very Large Array (VLA), which are presented in this paper for the first time.
2.1. Cross-matches
The association between Chandra and multiwavelength sources is not, in most of the cases, known a priori. We performed geometrical cross-matches between our Chandra candidates and multiwavelength sources. A positive match satisfies
 (1)
(1)
where θsep is the angular separation between a Chandra source and a multiwavelength source, err_ellipse_r0 is the major radius of the 95% confidence level (CL) position error ellipse of the Chandra source and θMW is the error on the position of the multiwavelength source at the same CL. The CSC provides error measurement at the 95% CL only. Therefore, for consistency, we use this CL throughout the paper. We note that this cross-match method inevitably leads to spurious associations. Our primary goal here, however, is not to formally associate Chandra sources with their multiwavelength counterparts, but rather to identify those having potential association(s). Depending on the emission intensity and spectral domain of the counterpart, our associations are either excluding or accepting candidates. Our cross-matching procedure is a trade off between purity and completeness, that is, we reject sources to increase the proportion of true MSPs in our sample, but the latter might not be complete because some MSPs could be mistakenly rejected. We note that such trade off is commonly applied in pulsar searches (see, e.g., Sobey et al. 2022, who furthermore used a constant cross-match radius of 10 arcsec around radio sources). A second parameter of the Chandra sources that will be useful for some of the cross-matches is the energy flux recorded in the Chandra broad band (0.5−7 keV), flux_aper90_b.
2.2. Catalogs
2.2.1. Optical
The Gaia mission (Gaia Collaboration 2016) has mapped the entire celestial sphere for nearly a decade and provides precise measurements for more than 1 billion stars down to magnitudes of ∼20 in the G band (330−1050 nm). The latest Gaia data release contains positions and G-band magnitudes for 1.8 billion sources. We associated our Chandra MSP candidates with their potential Gaia counterparts following the procedure described in Sect. 2.1, neglecting the error on the optical sources by setting
 (2)
(2)
in Eq. (1). The results of the X-optical associations are presented in Sect. 3.1 as well as the resulting exclusions.
2.2.2. Ultraviolet
For the UV associations, we made use of the latest release of the XMM-OM Serendipitous Ultraviolet Source Survey catalog, XMM-OM-SUSS5.03 (Page et al. 2012). The catalog contains more than 8 million entries, corresponding to almost 6 million sources detected by the Optical Monitor (OM) on board the X-ray Multi-Mirror Mission spacecraft, XMM-Newton, between 180 and 361 nm. About 280 000 entries fall in our ROI, but the sky coverage of XMM-OM, similar to Chandra’s one, is patchy. Hence, some MSP candidate positions were not observed and cannot reveal any UV counterpart. However, the UV survey covers almost entirely the region with |l|< 1° and −2° < b < 1.5°, which contains the majority of our candidates. We followed the cross-match procedure described in Sect. 2.1 with
 (3)
(3)
where POSERR is the 68% CL uncertainty on the position of the UV source. We assumed that POSERR has a Gaussian distribution, so that 2 × POSERR is the 95% CL uncertainty on the position. The results of the X-UV associations are presented in Sect. 3.2 together with the resulting exclusions.
2.2.3. Near-infrared
We performed the Chandra-near IR (NIR) associations with three different surveys. The first one is the Two Micron All Sky Survey (hereafter 2MASS, Skrutskie et al. 2006), which has detected more than 500 million sources over the entire sky, in the J (1.235 μm), H (1.662 μm), and Ks bands (2.159 μm). The magnitude of the detected sources ranges between −4 and 16 mag, with an astrometric accuracy better than 300 mas.
Second, we used the last release4 of the VISTA Variables of the Via Lactea survey (hereafter VVV, Minniti et al. 2010), which has observed the inner Galaxy and identified about half a billion of sources down to Ks magnitudes of ∼17 mag. Sources without a Ksmag1, the aperture-corrected Ks magnitude for the smallest source diameter (1 arcsec), in the VVV catalog, were ignored in this work.
Finally, we used the catalog of the United Kingdom Infrared Telescope Deep Sky Survey of the Galactic plane5 (hereafter UKIDSS, Lucas et al. 2008), which contains about half a billion sources. The median 5σ depth of the survey is better than ∼18 mag in all three bands (J, H, and Ks). The UKIDSS catalog provides two measurements of the Ks magnitude, Kmag1 and Kmag2, corresponding to two different epochs. Sources with no Ks measurement were ignored.
All three catalogs presented above cover our whole ROI. As for the Gaia objects, we have neglected the positional error of the NIR sources in the cross-match procedure (Eq. (2)). The exclusion or acceptance of candidates resulting from these associations depends on the X-ray and the NIR emissions; the results are presented in Sect. 3.3.2.
We also looked for counterparts in the 2MASS Extended Catalog (2MASX, Jarrett et al. 2000). We identified the MSP candidates overlapping 2MASX sources by replacing Equation (1) by
 (4)
(4)
in the cross-match procedure, with rext being the radius of the 2MASX source. Results are presented in Sect. 3.3.3.
2.2.4. Far-infrared
For the associations with sources of the far-infrared (FIR) domain, we used the Galactic Legacy Infrared Midplane Survey Extraordinaire (GLIMPSE) data6 collected by the Infrared Array Camera (IRAC) aboard the Spitzer Space Telescope (Benjamin et al. 2003). The survey covers the entire region |l|< 65° and |b|< 1° and goes up to |b|< 4.2° in some regions, including our ROI. It detected sources between 3.6 and 8 μm providing 3σ point-source sensitivity limit of 13−15.5 mag depending on the band. Each source of the catalog has a 0.3 arcsec error on its right ascension and declination, and we used 0.3 arcsec as an estimation of the 1σ uncertainty on the position of the GLIMPSE sources. Therefore, the value of θMW used in Eq. (1) is
 (5)
(5)
We note that the IRAC data were band merged with the 2MASS All-Sky Point Source Catalog and the potential 2MASS counterparts of GLIMPSE sources are recorded in the catalog, together with their Ks magnitude. The results of the X-FIR associations are presented in Sect. 3.3.4 as well as the resulting exclusions.
2.2.5. NVSS
The NRAO VLA Sky Survey (NVSS) has covered more than 80% of the celestial sphere, including the Galactic center and produced a catalog of 1.7 × 10⁶ sources stronger than 2.5 mJy at 1.4 GHz (Condon et al. 1998). We used
 (6)
(6)
in Eq. (1), with eRA (eDec) the error on the right ascension (declination) of the NVSS source. Conclusions on the Chandra-NVSS associations are presented in Sect. 3.4. We note that a new VLA Sky Survey has recently started (Lacy et al. 2020), but no catalog has been published yet.
2.3. VLA L-band Galactic center mosaic
Given the low point-source sensitivity of published radio data (Sect. 2.2.5), we decided to analyze 28 h of unpublished radio observations with the Karl G. Jansky Very Large Array (VLA) from project S9145 (PI: M. Kerr). We note that these data were used by Hyman et al. (2019) to detect the very steep-spectrum polarized source C1748–2728, an MSP candidate in the GC. We checked that this source has no possible counterpart in the CSC. The VLA data were collected with 28 telescope pointings in a region around the Galactic center covering about 2° in longitude and 3° in latitude (see Fig. 1). The total observation time was divided into twelve sessions of 2−4 h and observed from January 9 to 19, 2017 in the VLA’s A-configuration. Each session observed all 28 pointings for a duration of ∼200 s per pointing in the L band using a pseudo-continuum configuration of 16 spectral windows, each having 64 × 1 MHz channels, to achieve a 1024 MHz instantaneous bandwidth and continuous frequency coverage over the 1.008−2.032 GHz range. The sources 3C 286 and J1751−2524 were included in each session for flux and gain calibration, respectively.
2.3.1. Data reduction
The VLA data were reduced using CASA (CASA Team 2022), first by using the NRAO archive to apply the results of the VLA CASA calibration pipeline. The calibrated visibilities were split out by field center for each observing session and re-assembled into single-field data sets for further processing. A total of 62% of these data were flagged due to observing overheads, radio interference, and poor calibration. Each of the 28 fields were imaged separately using wsclean (Offringa et al. 2014), convolved to a common resolution of 1.9 arcsec, and assembled into a linear mosaic.
2.3.2. Data analysis
We looked for radio counterparts of the bulge MSP candidates by running a radio source detection algorithm, PyBDSF7, on the VLA mosaic. We selected squares of 100-pixel (∼20 arcsec) sides around the position of the ∼900 X-ray candidates covered by the VLA observations and ran PyBDSF on each of these regions. The algorithm calculates the background root mean square (RMS) in the reduced image, which goes up to ∼0.5 mJy in the Galactic plane and on the borders of the mosaic and down to ∼0.02 mJy outside of the plane. Then, it identifies pixels with flux larger than tpix times the RMS and looks for islands of pixels with flux larger than tisl times the RMS around them. tpix and tisl are threshold values defined either by the user (hard thresholds) or automatically computed with the false-detection-rate (FDR) method of Hopkins et al. (2002) implemented in PyBDSF. A Gaussian is then fit to each island. Certain sources (i.e., extended ones) sometimes require several Gaussians. We tested several configurations of the PyBDSF algorithm: (i) a hard-threshold configuration with tisl = 3 and tpix = 5, (ii) a second one with tisl = 2 and tpix = 3, and (iii) the FDR method. Configuration ii is motivated by the faintness of the sources that we are looking for, ∼100 μJy (see also Sect. 3.4 for a discussion on the radio emission of known MSPs).
This procedure identifies all radio sources in a 100-pixel-side square around Chandra sources. As a second step, we applied the cross-match method described in Sect. 2.1 in order to find the radio counterparts of the MSP candidates. We neglected the error on the position of the radio sources, using Eq. (2) again. A potential counterpart here would not exclude the pulsar nature. Therefore, unlike optical, UV, and FIR cross-matches, candidates with radio counterparts are tagged and remain in our selection, at least in a first stage, while candidates without radio counterparts are not dismissed (accept for association; see Sect. 2.1). More details will be provided in Sect. 3.4.
3. Multiwavelength identification of Chandra MSP candidates
3.1. Optical constraints with Gaia
Berteaud et al. (2021), based on the work of Antoniadis (2021), explain that the optical counterparts of bulge MSPs should not be visible for Gaia. This results from the combination of dim luminosities, strong absorption and large distances. Following the procedure described in Sect. 2.2.1, we identified all MSP candidates with optical counterpart(s). From the 3158 sources selected in Berteaud et al. (2021), 800 were found to have at least one Gaia counterpart and were excluded. 2358 sources survived this selection. Positions are shown in Fig. 1.
In order to estimate the proportion of spurious associations, we shifted the positions in the Gaia catalog by 5, 10, and 30 arcsec. The cross-match with no shift produces the maximum number of positive associations, with an excess from ∼8 to ∼16% of positive matches with respect to the cross-match with shifts.
3.2. Ultraviolet constraints with XMM OM
Just as optical light, UV light from bulge MSPs is expected to be dim. Hence, we also disregarded any candidate with UV counterparts. Among the 3158 candidates from Berteaud et al. (2021), we found 90 sources matching positively with XMM-OM sources. 30 of the MSP candidates matching with an XMM-OM source previously matched with an optical source (at least). Therefore, only 60 new objects were rejected from the candidate sample, which reduced to 2298 sources. Positions are again shown in Fig. 1.
3.3. Infrared constraints
Given the increasing sensitivity of IR instruments, the IR counterparts of MSPs in binary systems (i.e., the emission from their companion), although very faint, could be detectable. In order to distinguish them from other types of objects, we used the compact-object criterion.
3.3.1. Compact object criterion
Lin et al. (2012) showed that compact objects have a high X-to-IR flux ratio, with
 (7)
(7)
where FXMM is the 0.2−12 keV absorbed X-ray flux seen by XMM,
 (8)
(8)
is the infrared flux in the 2MASS Ks band in erg cm−2 s−1, and ks is the magnitude in this same band. In the following, we assume that the magnitude in the Ks band does not vary from one telescope to another, so Eq. (7) also applies to IR catalogs other than 2MASS. As for the X-ray flux, the Chandra broad band being narrower than the XMM one mentioned above, we calculated, using the simulated MSP population of Berteaud et al. (2021), that the XMM flux of (Chandra-)detectable bulge MSPs should be at least equal to, and at most three times larger than, than the Chandra broad-band flux. In the following, we assume
 (9)
(9)
for all MSP candidates, so we did not miss any compact object. The compact-object criterion (Eq. (7)) was established from sources in the XMM catalog, which have an absorbing column density that is lower, on average, than the ones of bulge sources. However, the flux in band Ks is more affected by absorption than the X-ray flux of hard sources as our candidates. Therefore, the criterion also remains valid in the context of this work.
A positive cross-match verifying the compact-object criterion would not exclude a pulsar nature, quite the contrary. Thus, if a candidate has a possible NIR counterpart for which the compact-object criterion is respected, the candidate is kept, regardless of other NIR cross-matches (accepting association). On the contrary, if counterparts are found and none of them respect the criterion, we exclude the candidate from the selection.
3.3.2. Near-infrared point sources
A total of 1608 unique objects of the selection of Berteaud et al. (2021) matched positively with 2MASS, VVV, or UKIDSS sources, 1399 of which are too bright in the NIR to be MSPs. The other 209 sources respect the compact-object criterion, but 130 of them also match with UV or optical sources. We kept the 79 X-NIR sources with neither optical nor UV counterparts as compact-object (and therefore MSP) candidates for now. Among the ∼1400 (∼1200) Chandra-VVV (-UKIDSS) associations, ∼90 (∼190) respect the compact-object criterion, including about 1/3 of matches with a unique potential association and 2/3 with at least two potential associations, including at least one respecting the criterion. There is of course some overlap between the associations made VVV and UKIDSS. The contribution of 2MASS sources to the compact-object candidates is negligible. In summary, 1608 candidates passed the NIR selection, and their positions are shown in Fig. 1.
3.3.3. Extended objects
We found a total of 72 MSP candidates from our conservative selection overlapping with five of the 2MASX sources in our ROI. Extended IR sources such as galaxies should be excluded from our MSP candidate selection, while extended IR sources like supernova remnants or pulsar wind nebulae should be kept. None of the 2MASX sources in our ROI are flagged as “found in galaxy catalog”. Therefore, the 72 positive cross-matches cannot be disregarded.
3.3.4. Background objects
We used the GLIMPSE data to identify reddened sources that we interpreted as background objects, that is, objects outside of the Milky Way and therefore outside of the Galactic bulge, or as obscured objects, which is not expected for bulge MSPs8. We found 613 positive cross-matches between the Chandra candidates of Berteaud et al. (2021) and GLIMPSE sources, which were all used to reduce the selection of MSP candidates. As previously mentioned, some GLIMPSE sources have been associated with 2MASS sources, and their Ks magnitude is provided in the catalog. The compact-object criterion was not verified for the 526 positive cross-matches with 2MASS associations. Out of the 79 compact-object candidates (VVV or UKIDSS counterpart) with neither UV nor optical counterpart, 22 matched positively with GLIMPSE sources and were excluded. 1422 candidates survived the FIR selection and their positions are shown in Fig. 1.
3.4. Radio associations and MSP-candidate identification
We found a total of 15 positive cross-matches between the Chandra-MSP candidates and NVSS sources, with 1.4 GHz fluxes between 3.2 and 350.5 mJy. In the Australia Telescope National Facility (ATNF) pulsar catalog (Antoniadis 2021), the largest 1.4 GHz pseudo-luminosity of an MSP is ∼170 mJy kpc2. Therefore, at 5.2 or 8.5 kpc, this source would have a flux of 2.35 or 6.29 mJy. Alternatively, a flux of 3.2 mJy at 5.2 kpc corresponds to a pseudo-luminosity of ∼87 mJy kpc2, which is only reached by three MSPs in the ATNF pulsar catalog. The bulk of the MSPs in the ATNF pulsar catalog has a luminosity ≤10 mJy kpc2, and so a flux below 140 μJy should they be located at the Galactic center. The radio fluxes of the Chandra-NVSS sources are probably too high for MSPs in the bulge, but these candidates were not excluded at this point.
We found a total of 13 positive cross-matches between Chandra-MSP candidates and VLA sources found with PyBDSF: eight are found in all PyBDSF-parameters configurations (i, ii, and FDR) and five in the loosest configuration only (ii). For consistency, all values (e.g., positions and fluxes) quoted in what follows refer to the results obtained in the loose configuration. To the best of our knowledge, at this point of our analysis, these sources only emit in radio and X-rays, except one that also has a UKIDSS counterpart that respects the compact-object criterion. We inspected all X-radio associations visually, thanks to plots similar to the ones shown in Figs. 2 and A.1, where we show the 100-pixel-side squares around the Chandra sources in the VLA mosaic, with the position of the X-ray and the radio sources. We conclude that two sources are actually noise, given the general aspect of the ∼20 arcsec side radio image, that another one is an active galactic nucleus (confirming the statement of Page et al. 2012) and that another one is resolved by the telescope (i.e., extended), while pulsars should be point-like, compact sources. We considered a source to be resolved when the width of the Gaussian fit to the island divided by the telescope synthesized beam width was larger than 1.5. These four sources are not further considered as radio MSP candidates.
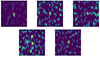 |
Fig. 2. Association of Chandra MSP candidates with VLA sources for our top priority candidates. The red crosses show the position of MSP candidates detected by Chandra. The red circle around them has a radius of err_ellipse_r0. The blue crosses indicate the position of radio sources detected by PyBDSF (configuration ii). When the blue cross falls inside the red circle, we consider the X-ray and radio sources to be associated. The colored background shows the VLA mosaic data in units of μJy beam−1 in ∼20 arcsec-side squares around the X-ray sources. The color-scale is linear between 0 (purple) and the peak flux of the associated radio source quoted in Table 1 (yellow). From top left to bottom right, the Chandra sources are 2CXO J173946.6–282913, 2CXO J174007.6–280708, 2CXO J174011.5–283221, 2CXO J174017.3–282843, and 2CXO J174053.7–275708. Other sources are shown in Fig. A.1. |
In order to make sure that we did not miss any other potential counterpart, we search the positions of the nine remaining Chandra sources in VizieR9, which browses about 27 000 catalogs to find neighboring sources. The procedure reveals that two candidates have a potential optical counterpart in the Panoramic Survey Telescope and Rapid Response System (Pan-STARRS) catalog10 (Chambers et al. 2016). Two other sources, the brightest of the nine (> 400 μJy), are found in quick-look images of the new VLA Sky Survey (Lacy et al. 2020). We do not find any counterpart for four of the remaining sources, while the fifth is the one with an NIR (UKIDSS) counterpart that verifies the compact-object criterion.
In conclusion, we identify five Chandra-MSP candidates with VLA association in the expected flux range (∼100 μJy), seen for the first time in radio. These candidates are the most promising sources in our sample that will be worth following up with dedicated observing time. We emphasize that other sources in our selection remain interesting MSP candidates. Table 1 summarizes our selections; our five top-priority candidates are highlighted in bold and shown in Fig. 2.
Summary of the radio cross-matches.
4. Summary and discussion
In Berteaud et al. (2021), we selected Chandra-MSP candidates whose X-ray flux and spectral properties are consistent with those of bulge MSPs. Thanks to multiwavelength associations, we have now reduced this selection by a factor of ∼2 (from 3158 to 1422). To the best of our knowledge, sources that we kept in our selection emit in X-rays, but they are faint in the optical, UV, and IR, in agreement with the multiwavelength properties of known MSPs. Our selection includes more than 50 compact-object candidates with faint IR emission that could be MSPs in binary systems.
To reveal the most promising candidates we investigated VLA observations and revealed ∼10 candidates having a radio counterpart in the range of flux anticipated for MSPs in the Galactic bulge. Five of them (highlighted in bold in Table 1) were selected for follow-up studies. Only four of them emit both in radio and X-rays, while the fifth one is also a compact-object candidate. Our global cross-match outcomes are summarized in Table 2.
Summary of the MSP candidate selection.
4.1. Comparison with candidates in the inner parsecs
Several groups recently published studies dedicated to populations of X-ray binaries (Hailey et al. 2018; Mori et al. 2021) and compact radio sources (Zhao et al. 2020) close to the Galactic center, which could include pulsars and MSPs. We investigate whether there is any overlap between their selections and the one presented in this work.
Hailey et al. (2018) and Mori et al. (2021) performed a dedicated Chandra data reduction to detect and investigate the nature of sources present in the central ∼15 pc. None of the 12 sources they identified as persistent X-ray binaries are found in any of our selections. Seven of the X-ray binary candidates are not even found in the CSC, while the five remaining ones are flagged as extended and variable in the CSC. Therefore, they were excluded already from our MSP candidate list in Berteaud et al. (2021). In this complex region, the CSC likely has several limitations, which can account for the discrepancies found.
Zhao et al. (2020) investigated the population of compact radio sources detected in a deep VLA image covering the central ∼40 pc and cross-matched their catalog with a dedicated Chandra catalog of this complex region created by Zhu et al. (2018). Two sources in our conservative selection could possibly be the X-ray counterparts of two compact radio sources identified by Zhao et al. (2020), who did the reverse exercise of finding X-ray counterparts to their sources and were indeed successful with the two radio sources mentioned above, for which they also reported X-ray counterparts. However, the two sources in our conservative selection were both disregarded as MSP candidates because one has a positive UV cross-match, while the second has a possible IR counterpart that does not respect the CO criterion. Other sources from Zhao et al. (2020) have possible counterparts in the CSC that are not in our selection because they are either extended, variable, or do not have the spectral shape expected for bulge MSPs. The remaining sources in their selection do not have possible X-ray counterparts in the CSC, and we emphasize that with our analysis, we cannot rule out their pulsar nature.
4.2. Nature of the remaining candidates
The vast majority of the sources surviving the multiwavelength cross-matches performed in this work are only detected in X-rays. We stress that, given the RMS of the VLA mosaic, the non-detection of the other MSP candidates in radio does not rule out their pulsar nature. In order to do so, and given the X-ray and radio properties of known MSPs, the RMS would need to improve by a factor of ∼2 at high latitudes, up to ∼100 in the Galactic plane, and even up to ∼500 (from ∼0.5 mJy beam−1 to ∼1 μJy beam−1) in the Galactic center region, where we have the highest density of candidates. We note that the RMS of the observations of Zhao et al. (2020) goes down to a few μJy, which is still slightly too high to allow exclusions based on the absence of radio counterparts.
Observations of the inner part of our Galaxy were recently made with the MeerKAT telescope array, precursor of the Square Kilometer Array SKA (Heywood et al. 2022), providing a total-intensity mosaic covering 6.5 sq. deg., with an angular resolution of 4 arcsec (i.e., about twice the one in the VLA mosaic; Sect. 2.3.1). Moreover, the RMS in these MeerKAT data is either equivalent to or larger than the VLA mosaic one, depending on the position. The catalog of radio sources associated with the MeerKAT observations could nonetheless benefit our analysis once publicly available (Rammala et al., in prep.).
The overall number of candidates we could not exclude as MSP candidates (∼1400) remains large compared with the predictions of X-ray detectable bulge MSPs from Berteaud et al. (2021) (∼100). A fraction of magnetic cataclysmic variables, which are one of the dominant populations in our ROI (Hong et al. 2009; Jonker et al. 2011), could match the multiwavelength criteria we used to select our candidates; this probably represents the dominant contamination of our MSP candidate sample. An analysis of the X-ray properties of the population of candidates is needed to quantify this contamination and understand the population of sources with only X-ray emission that we discovered. This analysis will be presented in a separate publication.
4.3. Conclusion
With this work, we show that multiwavelength association is a successful way to reject and identify promising MSP candidates among unidentified X-ray sources, opening up new avenues for the search for MSPs. The absence of a deep radio imaging survey in our ROI, reaching the flux level expected for the bulk of bulge MSPs, was the limited factor in the selection of candidates for follow-up studies. The results of our timing observations are beyond the scope of the present work and will be presented in a dedicated publication.
Computed from the 63 MSPs in the Australia Telescope National Facility (ATNF) pulsar catalog (Manchester et al. 2005) with 400 and 1400 MHz known fluxes.
3153 in our previous work; the difference is due to the use of the Chandra Source Catalog (CSC) equatorial – which are more precise – instead of the CSC Galactic coordinates when looking for counterparts.
Obscured objects typically have high-mass companions. While evolutionary tracks predict MSPs with high-mass companions to form systems such as the double pulsar PSR J0737–3039, this phase should be short lived (see, e.g., Dewi & van den Heuvel 2004, which is also consistent with the fact that no MSP with a high-mass companion is known). In addition, such high-mass stars are not typical in the bulge, making it even more unlikely to find such systems among our targets.
Had we used the Pan-STARRS catalog for the cross-matches, we would only have removed ∼70 additional sources.
Acknowledgments
J.B., F.C. and M.C. acknowledge financial support from the Programme National des Hautes Energies of CNRS/INSU with INP and IN2P3, co-funded by CEA and CNES, from the “Agence Nationale de la Recherche”, grant number ANR-19-CE310005-01 (PI: F. Calore), and from the Centre National d’Etudes Spatiales (CNES). This work supported by NASA under award number 80GSFC21M0002. Work at NRL is supported by NASA.
References
- Abdo, A. A., Ajello, M., Allafort, A., et al. 2013, ApJS, 208, 17 [Google Scholar]
- Agazie, G., Anumarlapudi, A., Archibald, A. M., et al. 2023, ApJ, 951, L8 [NASA ADS] [CrossRef] [Google Scholar]
- Antoniadis, J. 2021, MNRAS, 501, 1116 [Google Scholar]
- Benjamin, R. A., Churchwell, E., Babler, B. L., et al. 2003, PASP, 115, 953 [Google Scholar]
- Berteaud, J., Calore, F., Clavel, M., et al. 2021, Phys. Rev. D, 104, 043007 [CrossRef] [Google Scholar]
- Calore, F., Di Mauro, M., Donato, F., Hessels, J. W. T., & Weniger, C. 2016, ApJ, 827, 143 [NASA ADS] [CrossRef] [Google Scholar]
- Calore, F., Donato, F., & Manconi, S. 2021, Phys. Rev. Lett., 127, 161102 [CrossRef] [PubMed] [Google Scholar]
- CASA Team (Bean, B., et al.) 2022, PASP, 134, 114501 [NASA ADS] [CrossRef] [Google Scholar]
- Chambers, K. C., Magnier, E. A., Metcalfe, N., et al. 2016, ArXiv e-prints [arXiv:1612.05560] [Google Scholar]
- Condon, J. J., Cotton, W. D., Greisen, E. W., et al. 1998, AJ, 115, 1693 [Google Scholar]
- Coti Zelati, F., Torres, D. F., Li, J., & Viganò, D. 2020, MNRAS, 492, 1025 [NASA ADS] [CrossRef] [Google Scholar]
- Dewi, J. D. M., & van den Heuvel, E. P. J. 2004, MNRAS, 349, 169 [NASA ADS] [CrossRef] [Google Scholar]
- EPTA Collaboration (Antoniadis, J., et al.) 2023, A&A, 678, A50 [CrossRef] [EDP Sciences] [Google Scholar]
- Evans, I. N., Primini, F. A., Glotfelty, K. J., et al. 2010, ApJS, 189, 37 [NASA ADS] [CrossRef] [Google Scholar]
- Figer, D. F. 2009, in Massive Stars: From Pop III and GRBs to the Milky Way, eds. M. Livio, & E. Villaver, 40 [CrossRef] [Google Scholar]
- Gaia Collaboration (Prusti, T., et al.) 2016, A&A, 595, A1 [NASA ADS] [CrossRef] [EDP Sciences] [Google Scholar]
- Hailey, C. J., Mori, K., Bauer, F. E., et al. 2018, Nature, 556, 70 [Google Scholar]
- Han, J. L., Manchester, R. N., Xu, R. X., & Qiao, G. J. 1998, MNRAS, 300, 373 [NASA ADS] [CrossRef] [Google Scholar]
- Heywood, I., Rammala, I., Camilo, F., et al. 2022, ApJ, 925, 165 [NASA ADS] [CrossRef] [Google Scholar]
- Hong, J. S., van den Berg, M., Grindlay, J. E., & Laycock, S. 2009, ApJ, 706, 223 [NASA ADS] [CrossRef] [Google Scholar]
- Hopkins, A. M., Miller, C. J., Connolly, A. J., et al. 2002, AJ, 123, 1086 [NASA ADS] [CrossRef] [Google Scholar]
- Hyman, S. D., Frail, D. A., Deneva, J. S., et al. 2019, ApJ, 876, 20 [NASA ADS] [CrossRef] [Google Scholar]
- Jarrett, T. H., Chester, T., Cutri, R., et al. 2000, AJ, 119, 2498 [Google Scholar]
- Jonker, P. G., Bassa, C. G., Nelemans, G., et al. 2011, ApJS, 194, 18 [NASA ADS] [CrossRef] [Google Scholar]
- Kaplan, D. L., Cordes, J. M., Condon, J. J., & Djorgovski, S. G. 2000, ApJ, 529, 859 [NASA ADS] [CrossRef] [Google Scholar]
- Kaplan, D. L., Dai, S., Lenc, E., et al. 2019, ApJ, 884, 96 [NASA ADS] [CrossRef] [Google Scholar]
- Kramer, M., Stairs, I. H., Manchester, R. N., et al. 2021, Phys. Rev. X, 11, 041050 [NASA ADS] [Google Scholar]
- Lacy, M., Baum, S. A., Chandler, C. J., et al. 2020, PASP, 132, 035001 [Google Scholar]
- Lee, J., Hui, C. Y., Takata, J., et al. 2018, ApJ, 864, 23 [NASA ADS] [CrossRef] [Google Scholar]
- Lenc, E., Murphy, T., Lynch, C. R., Kaplan, D. L., & Zhang, S. N. 2018, MNRAS, 478, 2835 [Google Scholar]
- Lin, D., Webb, N. A., & Barret, D. 2012, ApJ, 756, 27 [NASA ADS] [CrossRef] [Google Scholar]
- List, F., Rodd, N. L., Lewis, G. F., & Bhat, I. 2020, Phys. Rev. Lett., 125, 241102 [CrossRef] [Google Scholar]
- List, F., Rodd, N. L., & Lewis, G. F. 2021, Phys. Rev. D, 104, 123022 [CrossRef] [Google Scholar]
- Lucas, P. W., Hoare, M. G., Longmore, A., et al. 2008, MNRAS, 391, 136 [Google Scholar]
- Manchester, R. N., Hobbs, G. B., Teoh, A., & Hobbs, M. 2005, AJ, 129, 1993 [Google Scholar]
- Minniti, D., Lucas, P. W., Emerson, J. P., et al. 2010, New Astron., 15, 433 [Google Scholar]
- Mishra-Sharma, S., & Cranmer, K. 2022, Phys. Rev. D, 105, 063017 [NASA ADS] [CrossRef] [Google Scholar]
- Mori, K., Hailey, C. J., Schutt, T. Y. E., et al. 2021, ApJ, 921, 148 [NASA ADS] [CrossRef] [Google Scholar]
- Muno, M. P., Baganoff, F. K., Brandt, W. N., Morris, M. R., & Starck, J. L. 2008, ApJ, 673, 251 [Google Scholar]
- Muno, M. P., Bauer, F. E., Baganoff, F. K., et al. 2009, ApJS, 181, 110 [CrossRef] [Google Scholar]
- Murgia, S. 2020, Annu. Rev. Nucl. Part. Sci., 70, 455 [NASA ADS] [CrossRef] [Google Scholar]
- Offringa, A. R., McKinley, B., Hurley-Walker, N., et al. 2014, MNRAS, 444, 606 [Google Scholar]
- Page, M. J., Brindle, C., Talavera, A., et al. 2012, MNRAS, 426, 903 [NASA ADS] [CrossRef] [Google Scholar]
- Pfahl, E., & Loeb, A. 2004, ApJ, 615, 253 [Google Scholar]
- Psaltis, D., Wex, N., & Kramer, M. 2016, ApJ, 818, 121 [Google Scholar]
- Reardon, D. J., Zic, A., Shannon, R. M., et al. 2023, ApJ, 951, L6 [NASA ADS] [CrossRef] [Google Scholar]
- Skrutskie, M. F., Cutri, R. M., Stiening, R., et al. 2006, AJ, 131, 1163 [NASA ADS] [CrossRef] [Google Scholar]
- Smith, D. A., Abdollahi, S., Ajello, M., et al. 2023, ApJ, 958, 191 [NASA ADS] [CrossRef] [Google Scholar]
- Sobey, C., Bassa, C. G., O’Sullivan, S. P., et al. 2022, A&A, 661, A87 [NASA ADS] [CrossRef] [EDP Sciences] [Google Scholar]
- Torne, P., Liu, K., Eatough, R. P., et al. 2023, ApJ, 959, 14 [NASA ADS] [CrossRef] [Google Scholar]
- Tranin, H., Godet, O., Webb, N., & Primorac, D. 2022, A&A, 657, A138 [NASA ADS] [CrossRef] [EDP Sciences] [Google Scholar]
- Wex, N., & Kopeikin, S. M. 1999, ApJ, 514, 388 [Google Scholar]
- Xu, H., Chen, S., Guo, Y., et al. 2023, Res. Astron. Astrophys., 23, 075024 [CrossRef] [Google Scholar]
- Yao, J. M., Manchester, R. N., & Wang, N. 2017, ApJ, 835, 29 [NASA ADS] [CrossRef] [Google Scholar]
- Yunes, N., Miller, M. C., & Yagi, K. 2022, Nat. Rev. Phys., 4, 237 [NASA ADS] [CrossRef] [Google Scholar]
- Zhao, J.-H., Morris, M. R., & Goss, W. M. 2020, ApJ, 905, 173 [NASA ADS] [CrossRef] [Google Scholar]
- Zhu, Z., Li, Z., & Morris, M. R. 2018, ApJS, 235, 26 [NASA ADS] [CrossRef] [Google Scholar]
Appendix A: Other Chandra-VLA cross-matches
In Section 3.4, we explain how we selected our five top-priority candidates for radio follow-ups among the 13 positive Chandra-VLA cross-matches. In this appendix, we show the VLA images of the eight candidates that were not selected, because of their size, nature, or spectral index for example.
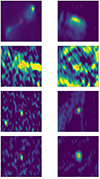 |
Fig. A.1. Same as Figure 2, but for (from top left to bottom right): 2CXO J174000.6–274816, 2CXO J174810.0–285650, 2CXO J174602.4–284308, 2CXO J174616.3–284739, 2CXO J173801.2–281352, 2CXO J174000.7–274859, 2CXO J174309.3–292857, and 2CXO J174343.4–291358. These sources were not selected for follow-up studies because they are either an AGN (top left), not compact (top right), noise (second line), have an optical counterpart (third line) or have a relatively strong and previously known radio emission (bottom line). The color scale for the AGN is linear between 0 and 8522 μJy/beam, the maximal peak flux in the box. |
All Tables
All Figures
|
Fig. 1. Positions of MSP candidates after successive selections: conservative selection of Berteaud et al. (2021) (dark blue) after removing those with optical (Sect. 3.1, blue), UV (Sect. 3.2, teal), strong NIR (Sect. 3.3.2, green), and FIR (Sect. 3.3.4, yellow) counterparts. Some of these sources have a potential VLA (radio) counterpart and/or are compact-object (CO) candidates (red crosses). Sources from the conservative selection of Berteaud et al. (2021) for which we found an optical counterpart therefore appear as single dark blue circles; those without an optical counterpart but with a UV one appear as a blue circle with a dark blue ring, etc. The shaded region shows the approximate coverage of the VLA mosaic (orange). The spatial distribution of the candidates is correlated with the sensitivity threshold of Chandra. |
| In the text | |
|
Fig. 2. Association of Chandra MSP candidates with VLA sources for our top priority candidates. The red crosses show the position of MSP candidates detected by Chandra. The red circle around them has a radius of err_ellipse_r0. The blue crosses indicate the position of radio sources detected by PyBDSF (configuration ii). When the blue cross falls inside the red circle, we consider the X-ray and radio sources to be associated. The colored background shows the VLA mosaic data in units of μJy beam−1 in ∼20 arcsec-side squares around the X-ray sources. The color-scale is linear between 0 (purple) and the peak flux of the associated radio source quoted in Table 1 (yellow). From top left to bottom right, the Chandra sources are 2CXO J173946.6–282913, 2CXO J174007.6–280708, 2CXO J174011.5–283221, 2CXO J174017.3–282843, and 2CXO J174053.7–275708. Other sources are shown in Fig. A.1. |
| In the text | |
|
Fig. A.1. Same as Figure 2, but for (from top left to bottom right): 2CXO J174000.6–274816, 2CXO J174810.0–285650, 2CXO J174602.4–284308, 2CXO J174616.3–284739, 2CXO J173801.2–281352, 2CXO J174000.7–274859, 2CXO J174309.3–292857, and 2CXO J174343.4–291358. These sources were not selected for follow-up studies because they are either an AGN (top left), not compact (top right), noise (second line), have an optical counterpart (third line) or have a relatively strong and previously known radio emission (bottom line). The color scale for the AGN is linear between 0 and 8522 μJy/beam, the maximal peak flux in the box. |
| In the text | |
Current usage metrics show cumulative count of Article Views (full-text article views including HTML views, PDF and ePub downloads, according to the available data) and Abstracts Views on Vision4Press platform.
Data correspond to usage on the plateform after 2015. The current usage metrics is available 48-96 hours after online publication and is updated daily on week days.
Initial download of the metrics may take a while.