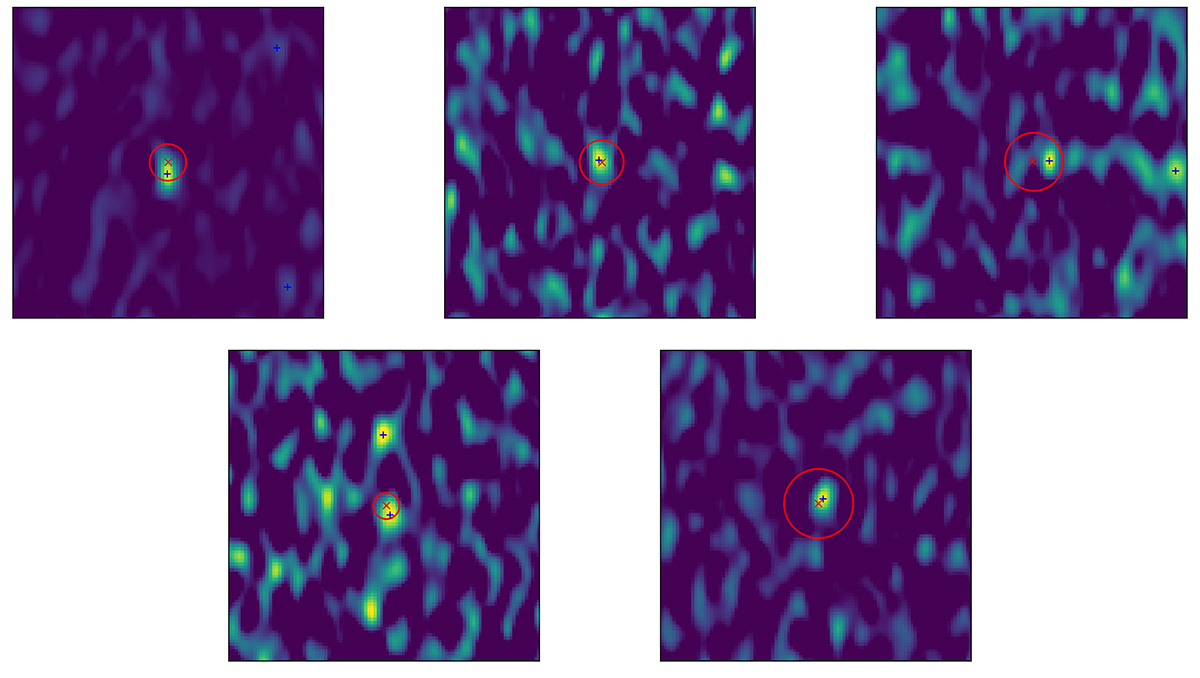
Fig. 2.
Download original image
Association of Chandra MSP candidates with VLA sources for our top priority candidates. The red crosses show the position of MSP candidates detected by Chandra. The red circle around them has a radius of err_ellipse_r0. The blue crosses indicate the position of radio sources detected by PyBDSF (configuration ii). When the blue cross falls inside the red circle, we consider the X-ray and radio sources to be associated. The colored background shows the VLA mosaic data in units of μJy beam−1 in ∼20 arcsec-side squares around the X-ray sources. The color-scale is linear between 0 (purple) and the peak flux of the associated radio source quoted in Table 1 (yellow). From top left to bottom right, the Chandra sources are 2CXO J173946.6–282913, 2CXO J174007.6–280708, 2CXO J174011.5–283221, 2CXO J174017.3–282843, and 2CXO J174053.7–275708. Other sources are shown in Fig. A.1.
Current usage metrics show cumulative count of Article Views (full-text article views including HTML views, PDF and ePub downloads, according to the available data) and Abstracts Views on Vision4Press platform.
Data correspond to usage on the plateform after 2015. The current usage metrics is available 48-96 hours after online publication and is updated daily on week days.
Initial download of the metrics may take a while.