Fig. 9.
Download original image
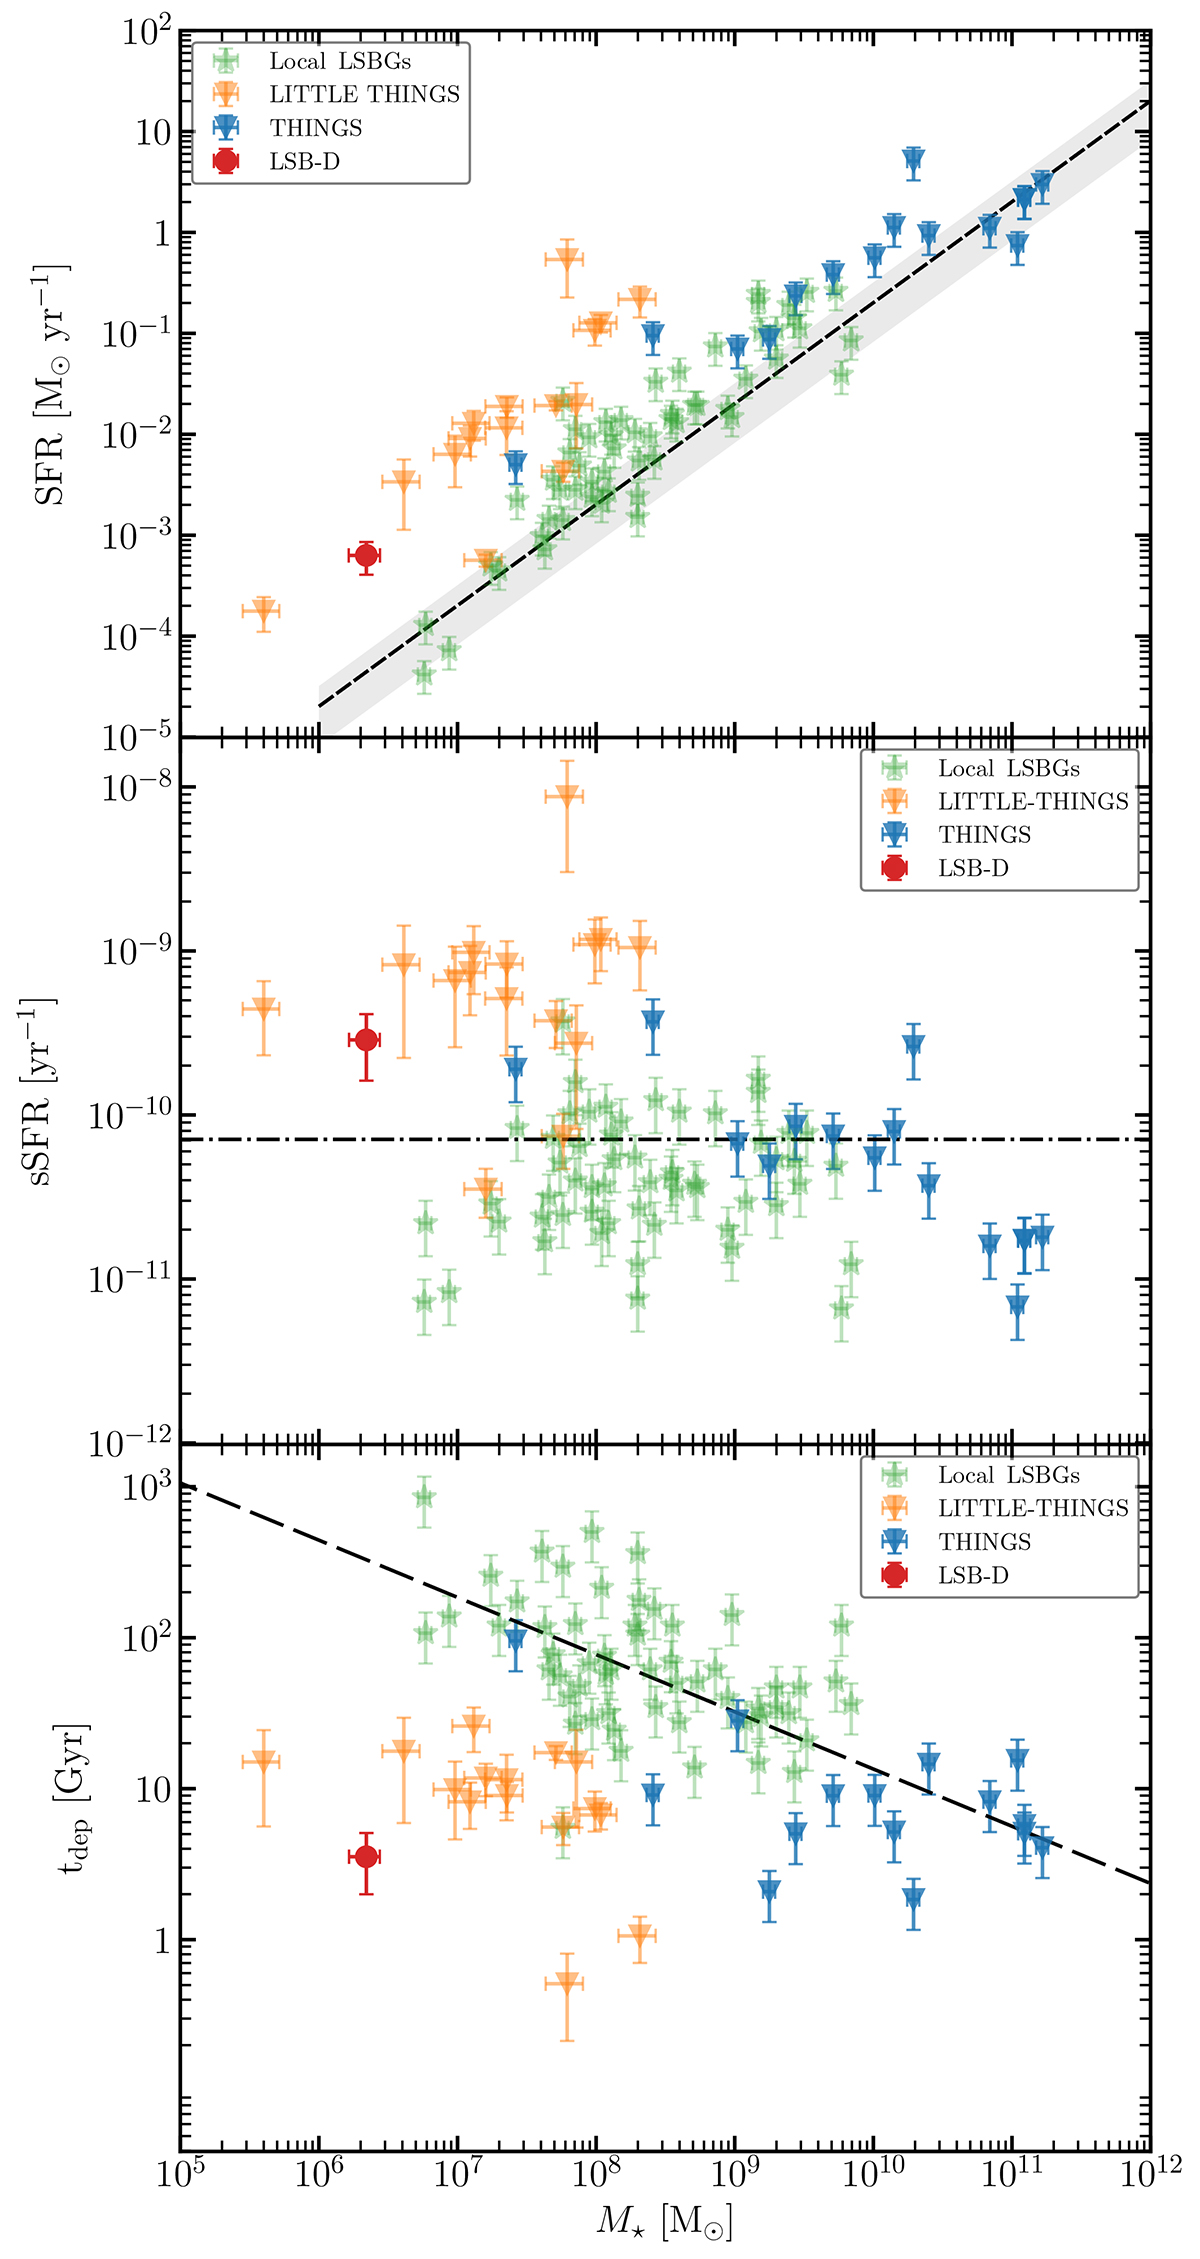
Top panel: star formation rate as a function of stellar mass for LSB-D (marked by the red circle, and for a sample of galaxies in the Local Universe. LITTLE-THINGS (Oh et al. 2015; Iorio et al. 2017) and THINGS galaxies are marked by orange and blue triangles. Local low surface brightness galaxies (LSBGs) from McGaugh (2011, 2017) are in green. The dashed line shows a linear relation fitted betwee the LSBGs and THINGS samples. Central panel: specific star formation rate as a function of stellar mass for the same sample as in the top panel. The dashed-dotted line marks the inverse Hubble time, i.e. galaxies on the relation reach their current stellar mass with their average SFR since the Big Bang. Bottom panel: depletion time as a function of stellar mass for LSB-D and the samples of galaxies in the Local Universe. The dashed line marks the linear fit relation for the Local LSBGs sample.
Current usage metrics show cumulative count of Article Views (full-text article views including HTML views, PDF and ePub downloads, according to the available data) and Abstracts Views on Vision4Press platform.
Data correspond to usage on the plateform after 2015. The current usage metrics is available 48-96 hours after online publication and is updated daily on week days.
Initial download of the metrics may take a while.