Fig. 7.
Download original image
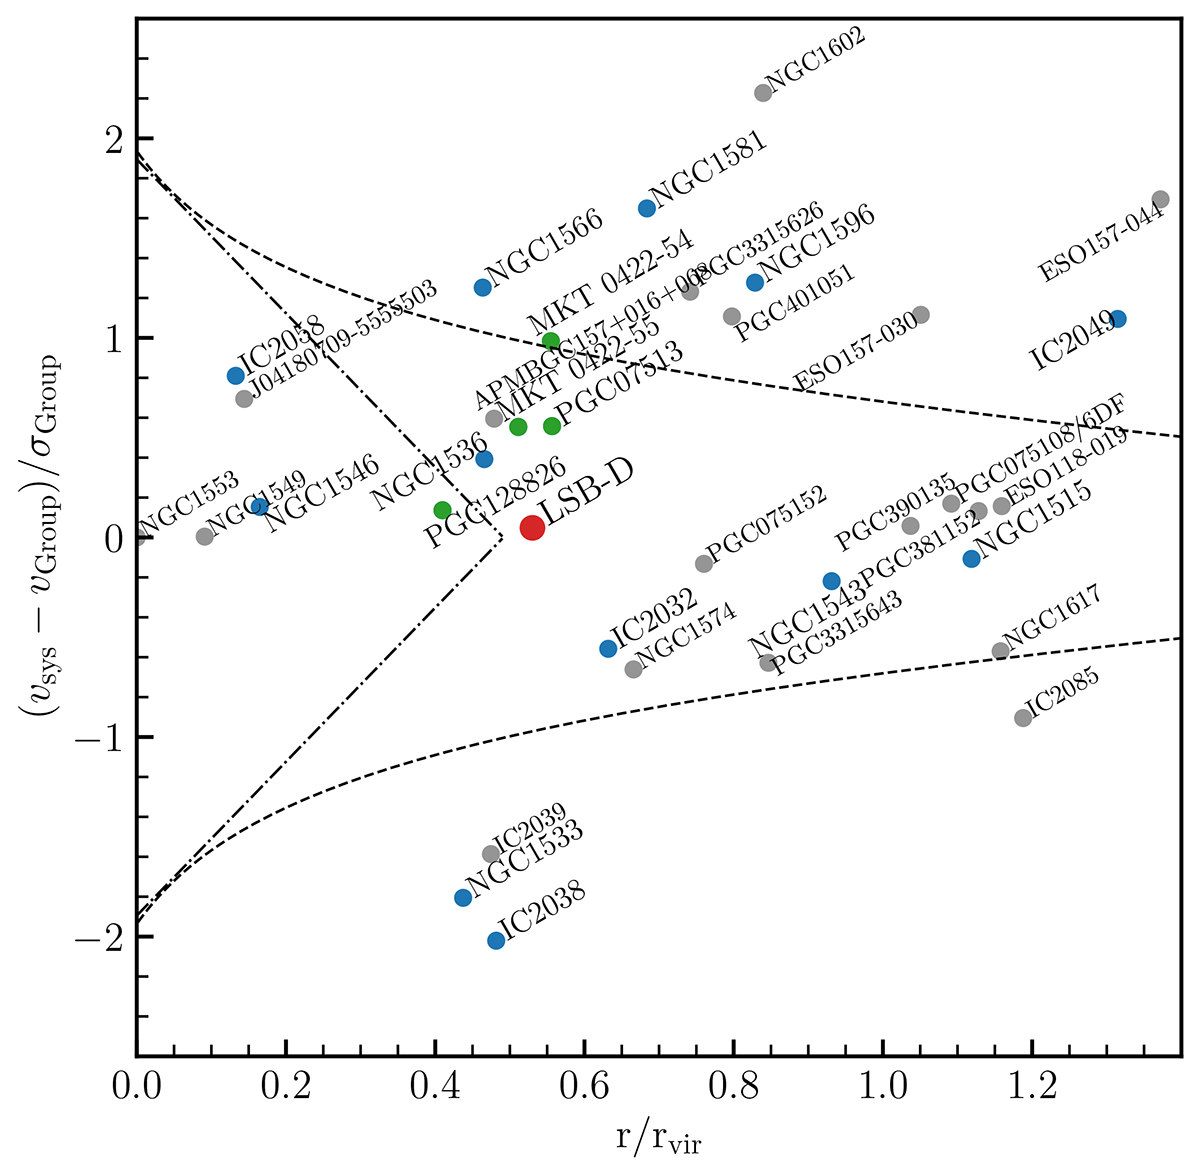
Phase-space diagram of the Dorado group. LSB-D is shown in red, while previously known H I rich galaxies are shown in blue and new H I detections in green. The group’s centre (NGC 1553) is at the zero coordinates, the dashed-dotted lines mark the virialised region of the Dorado group. The caustic curves (dashed lines) are defined by the escape velocity of the group.
Current usage metrics show cumulative count of Article Views (full-text article views including HTML views, PDF and ePub downloads, according to the available data) and Abstracts Views on Vision4Press platform.
Data correspond to usage on the plateform after 2015. The current usage metrics is available 48-96 hours after online publication and is updated daily on week days.
Initial download of the metrics may take a while.