Open Access
Fig. 5.
Download original image
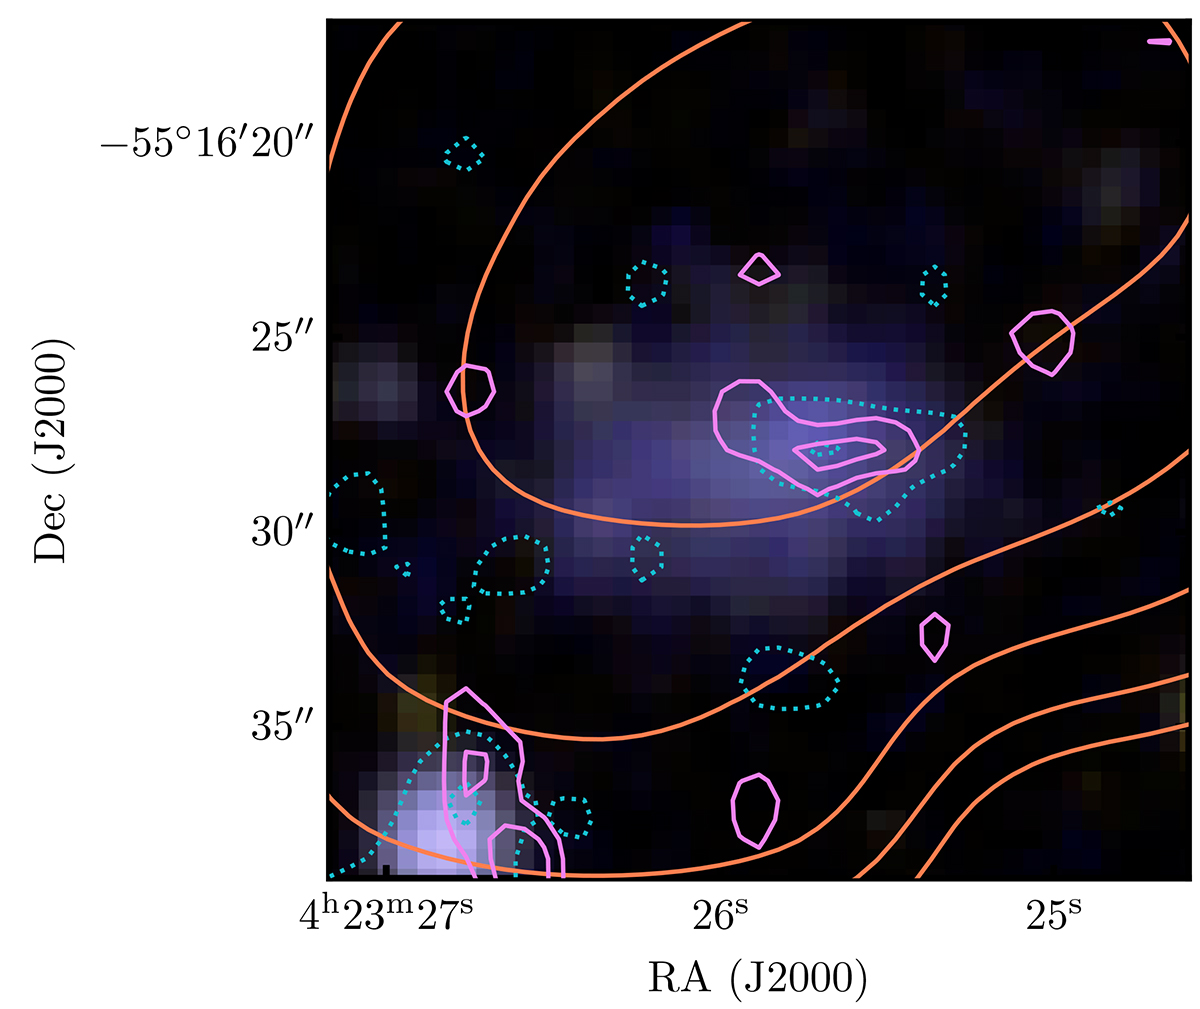
VEGAS optical image in the g, r filters overlaid with the H I column density map. Orange contour levels are as the left panel of Fig. 3. In cyan and magenta contours we show the S/N = 3 and 5 contours from the NUV and FUV GALEX observations, respectively.
Current usage metrics show cumulative count of Article Views (full-text article views including HTML views, PDF and ePub downloads, according to the available data) and Abstracts Views on Vision4Press platform.
Data correspond to usage on the plateform after 2015. The current usage metrics is available 48-96 hours after online publication and is updated daily on week days.
Initial download of the metrics may take a while.