Fig. 3.
Download original image
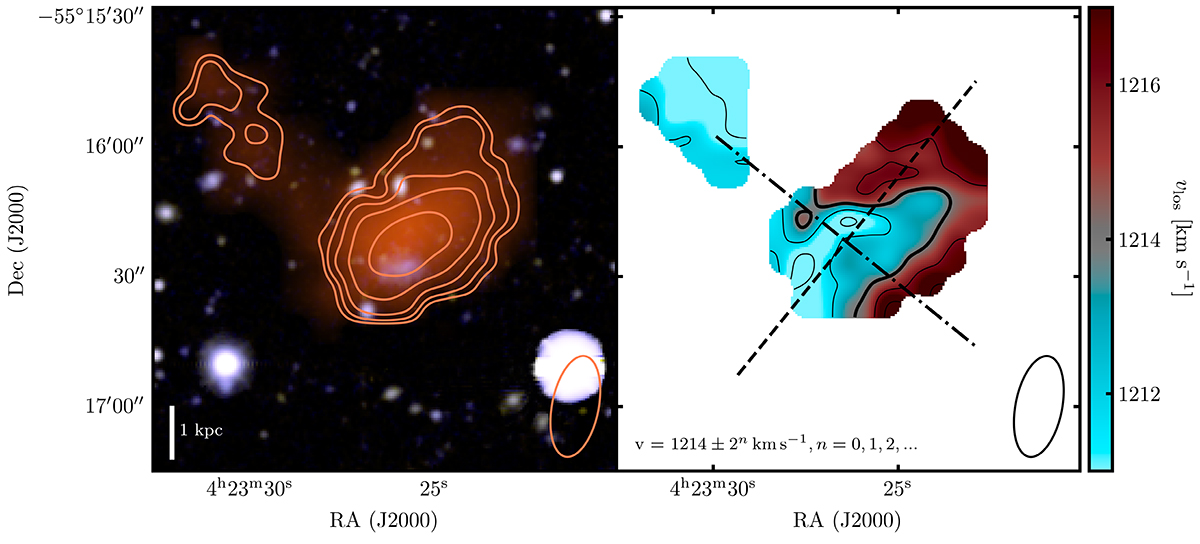
Left Panel: DeCaLS optical image in the g, r, z filters overlaid with the H I contours from the 25″ × 18″ datacube used for the analysis in this paper. Levels increase as 4.6 × 1018 × 2n cm−2 (n = 0, 1, 2, 3), where the first contour marks the mean S/N = 3 detection limit. The PSF is shown in the bottom-right corner. Note the H I overlay in color with also the 32 × 23 ″ map. Right Panel: velocity field of the H I gas in LSB-D. The systemic velocity (vsys = 1214 km s−1) is marked by the thick black iso-velocity contour, the other contour levels are shown in the bottom-left corner. The dashed and dashed-dotted lines mark the directions of the major (141°) and minor axes (51°) of the H I disk, respectively.
Current usage metrics show cumulative count of Article Views (full-text article views including HTML views, PDF and ePub downloads, according to the available data) and Abstracts Views on Vision4Press platform.
Data correspond to usage on the plateform after 2015. The current usage metrics is available 48-96 hours after online publication and is updated daily on week days.
Initial download of the metrics may take a while.