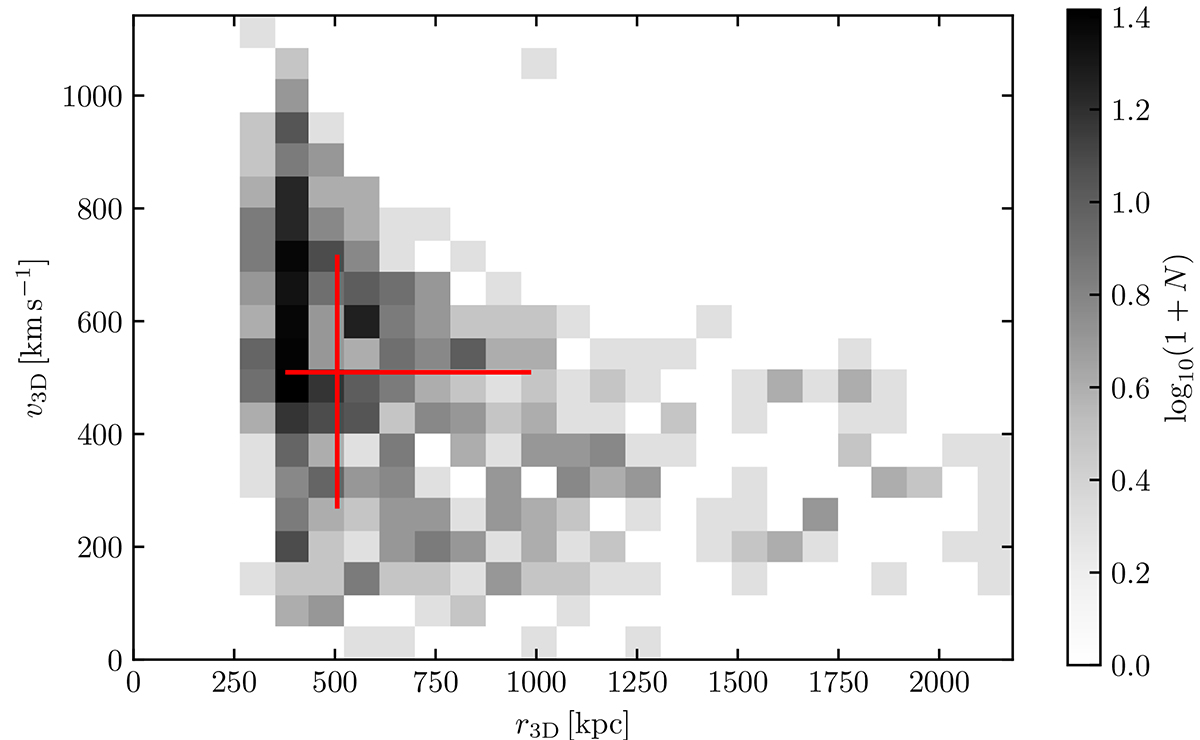
Fig. C.1.
Download original image
Deprojected coordinates of LSB-D derived from orbit catalogues following the methodology of Oman et al. (2021) as detailed in Sec. 3.1. The grayscale map shows a histogram of the deprojected coordinates for simulated satellites with projected coordinates, host mass and satellite mass compatible with those of LSB-D. The red lines mark the median and 16th-84th percentiles of the marginalised probability distributions for the deprojected radius r3D and current speed v3D.
Current usage metrics show cumulative count of Article Views (full-text article views including HTML views, PDF and ePub downloads, according to the available data) and Abstracts Views on Vision4Press platform.
Data correspond to usage on the plateform after 2015. The current usage metrics is available 48-96 hours after online publication and is updated daily on week days.
Initial download of the metrics may take a while.