Fig. B.1.

Download original image
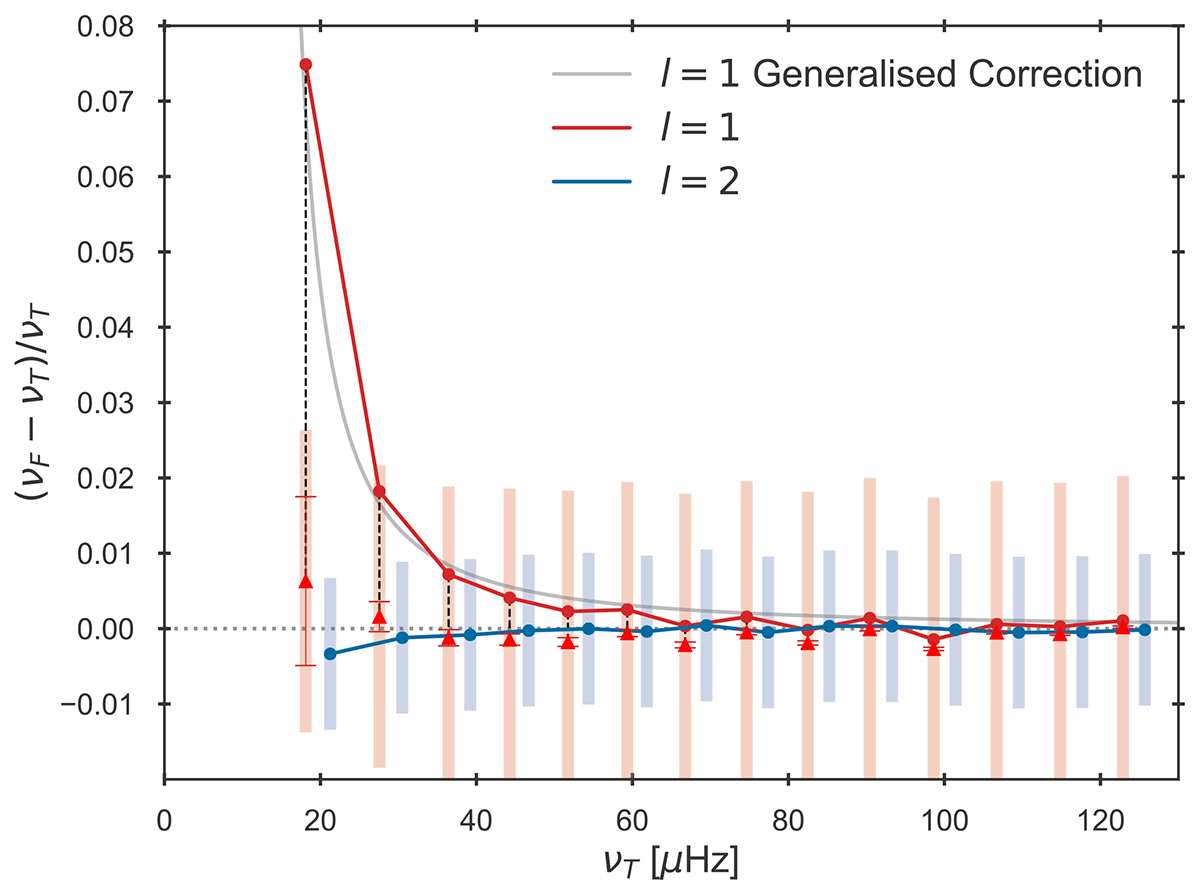
Visual representation of the frequency shift incurred on the truncated frequencies for model ℳ. The fractional frequency shift (νF − νT)/νT between the full (νF) and truncated (νT) frequencies is plotted against νT for the dipole and quadrupole modes, shown by the red and blue lines, respectively. The grey profile shows the resulting generalised correction for model ℳ overplotted, for which its value is subsequently subtracted from all dipole acoustic resonances to provide the red triangles. The uncertainty on the correction for each dipole mode is indicated, as well as the minimal size of the scanning interval boundary as the shaded beams in the respective colour.
Current usage metrics show cumulative count of Article Views (full-text article views including HTML views, PDF and ePub downloads, according to the available data) and Abstracts Views on Vision4Press platform.
Data correspond to usage on the plateform after 2015. The current usage metrics is available 48-96 hours after online publication and is updated daily on week days.
Initial download of the metrics may take a while.


