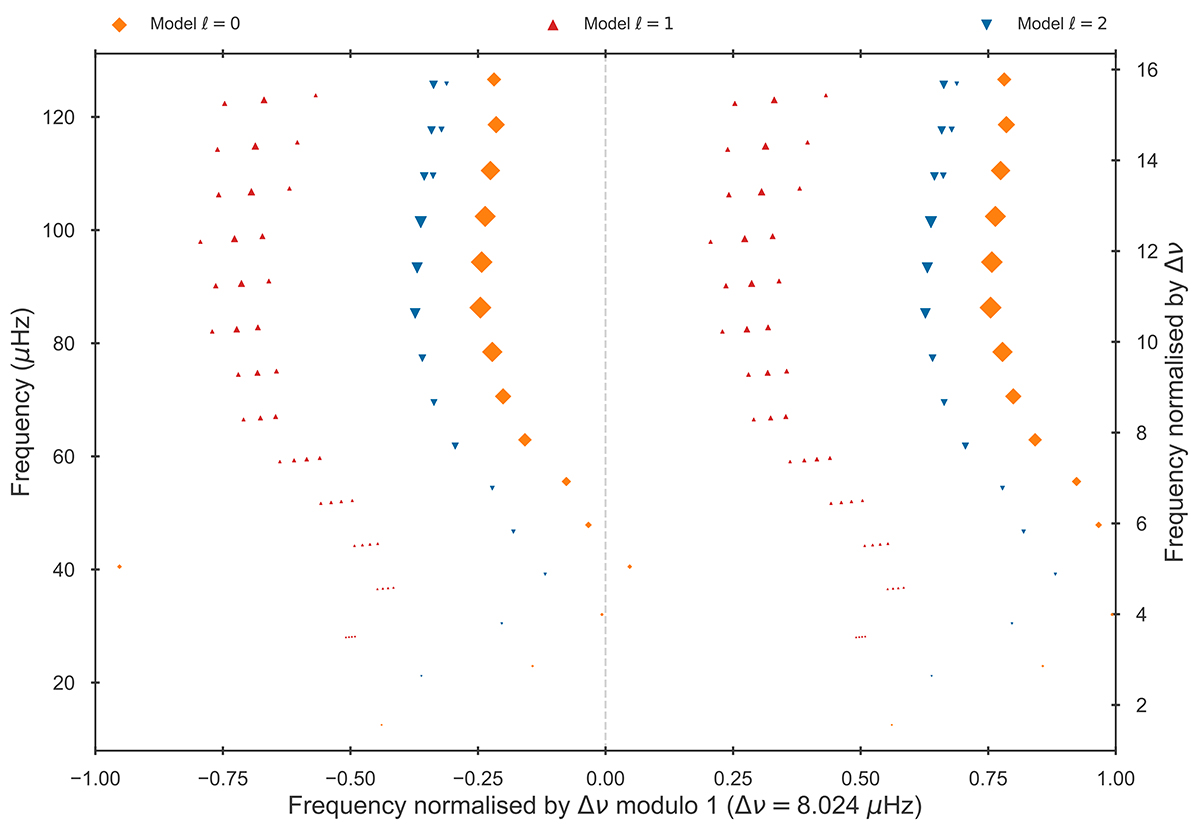
Fig. 7.
Download original image
Replicated échelle diagram of model ℳ obtained after application of the truncated scanning method to calculate red-giant oscillations. The orange diamonds, red upwards and blue downwards triangles depict the l = 0, l = 1 and l = 2 modes, respectively. A scaling in size related to the inverse of its inertia is applied to each plotted mode. The observable mixed-mode regions surrounding the acoustic resonances have been calculated and plotted for the dipole and quadrupole modes. For contrast to the initial situation, compare to Fig. 4.
Current usage metrics show cumulative count of Article Views (full-text article views including HTML views, PDF and ePub downloads, according to the available data) and Abstracts Views on Vision4Press platform.
Data correspond to usage on the plateform after 2015. The current usage metrics is available 48-96 hours after online publication and is updated daily on week days.
Initial download of the metrics may take a while.