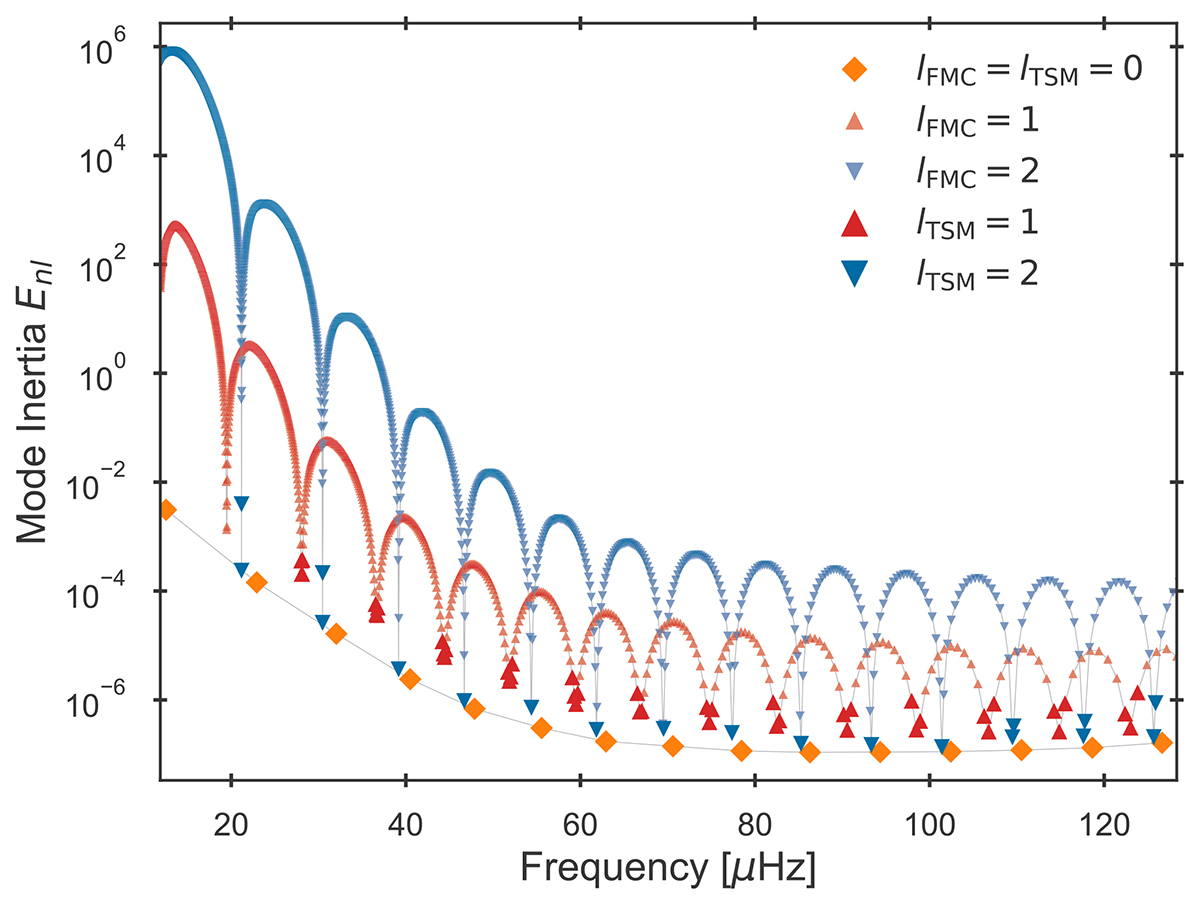
Fig. 6.
Download original image
Mode inertia for the model ℳ, depicting the modes from a full model (transparent points) and truncated scanning method (opaque points) calculation, abbreviated FMC and TSM, respectively. All plotted points are connected by a solid grey line to guide the eye. The inertia valleys containing observable p-mode-like oscillations for both the dipole (red) and quadrupole (blue) modes are recovered. The lowest-order dipole mode has been removed from consideration, as can be clearly seen at ν ≈ 20 μHz. Note that the recovered radial modes are identical for an FMC and TSM calculation.
Current usage metrics show cumulative count of Article Views (full-text article views including HTML views, PDF and ePub downloads, according to the available data) and Abstracts Views on Vision4Press platform.
Data correspond to usage on the plateform after 2015. The current usage metrics is available 48-96 hours after online publication and is updated daily on week days.
Initial download of the metrics may take a while.