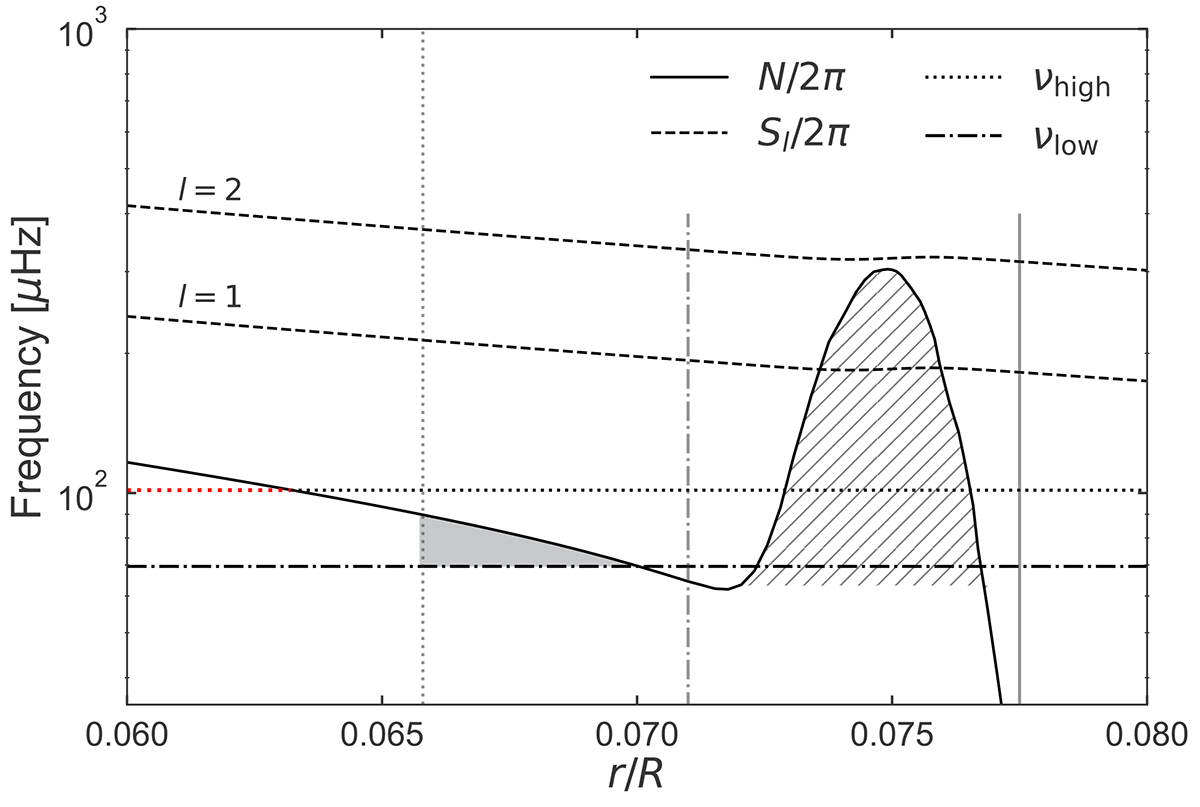
Fig. 5.
Download original image
Propagation diagram for model ℳ, displaying a zoomed-in view of Fig. 1 near the bottom of the convective region. The buoyancy frequency N/2π and Lamb frequency Sl/2π for l = 1, 2 are shown as the full and dashed (S2 being the higher) profiles, respectively. The horizontal dotted line indicates a representative high frequency νhigh of the model, with its g-mode cavity marked in red. The horizontal dot-dashed line shows a representative lower frequency νlow. The vertical dotted and dot-dashed grey lines indicate suitable respective truncation points in r/R. The vertical solid grey line represents a truncation point at the bottom of the convective region. The buoyancy glitch is marked as the hatched area.
Current usage metrics show cumulative count of Article Views (full-text article views including HTML views, PDF and ePub downloads, according to the available data) and Abstracts Views on Vision4Press platform.
Data correspond to usage on the plateform after 2015. The current usage metrics is available 48-96 hours after online publication and is updated daily on week days.
Initial download of the metrics may take a while.