Open Access
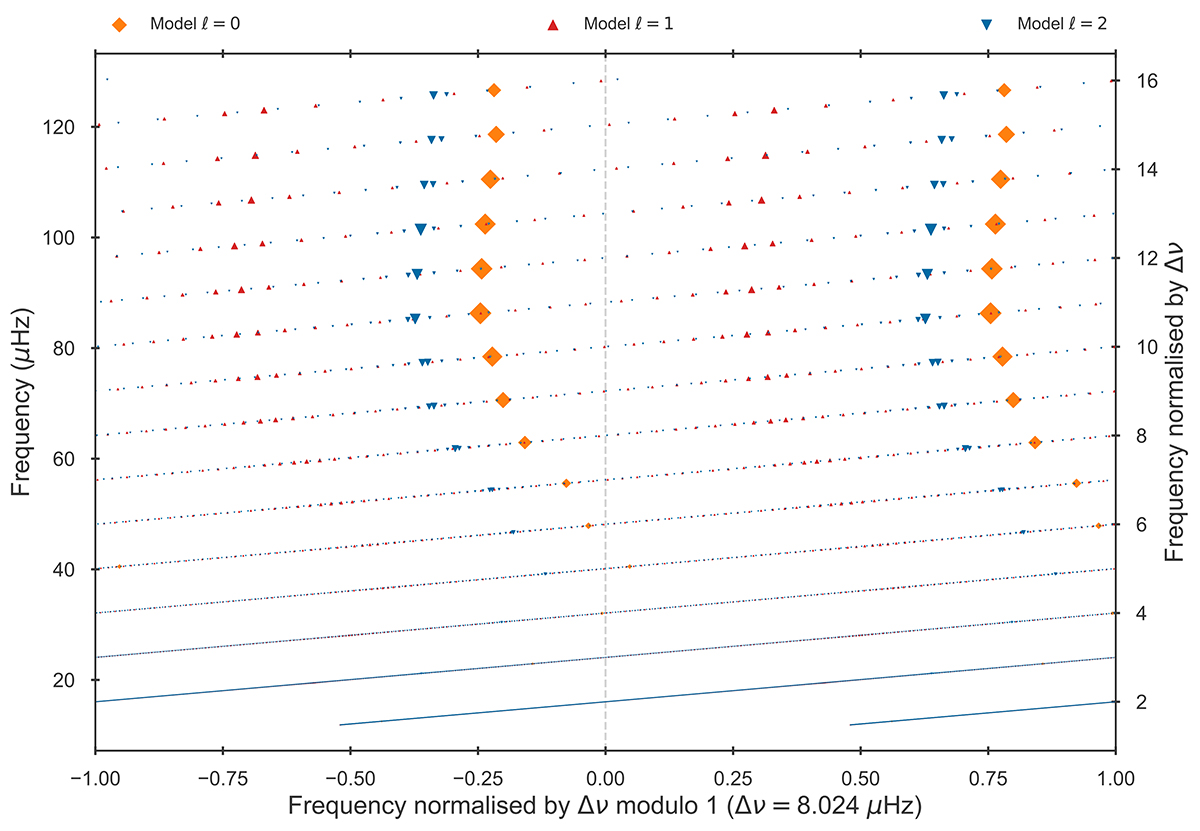
Fig. 4.
Download original image
Replicated échelle diagram of a full calculation of model ℳ. The orange diamonds, red upwards and blue downwards triangles depict the l = 0, l = 1 and l = 2 modes, respectively, for a model below the RGB bump. For each plotted mode, a scaling in size related to the inverse of its inertia is applied.
Current usage metrics show cumulative count of Article Views (full-text article views including HTML views, PDF and ePub downloads, according to the available data) and Abstracts Views on Vision4Press platform.
Data correspond to usage on the plateform after 2015. The current usage metrics is available 48-96 hours after online publication and is updated daily on week days.
Initial download of the metrics may take a while.