Fig. 2.
Download original image
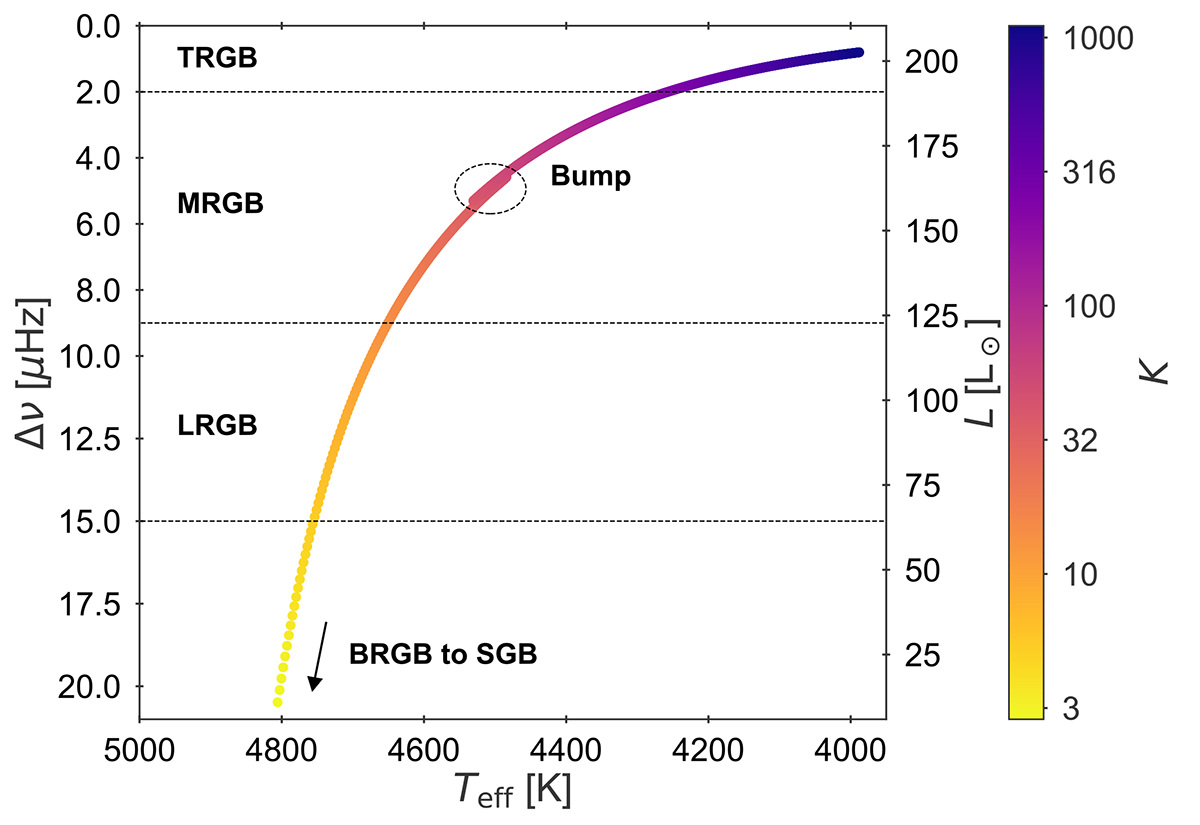
Evolutionary diagram for a solar stellar track with M = 1 M⊙ and [Fe/H] = 0 dex, plotting the large frequency separation Δν and luminosity L as a function of effective temperature Teff. The colour bar indicates the number of dipole modes in a Δν-wide frequency range around νmax, according to Eq. (4). The three classifications from top to bottom denote the tip (TRGB), middle (MRGB) and lower RGB (LRGB).
Current usage metrics show cumulative count of Article Views (full-text article views including HTML views, PDF and ePub downloads, according to the available data) and Abstracts Views on Vision4Press platform.
Data correspond to usage on the plateform after 2015. The current usage metrics is available 48-96 hours after online publication and is updated daily on week days.
Initial download of the metrics may take a while.