Fig. B.4.
Download original image
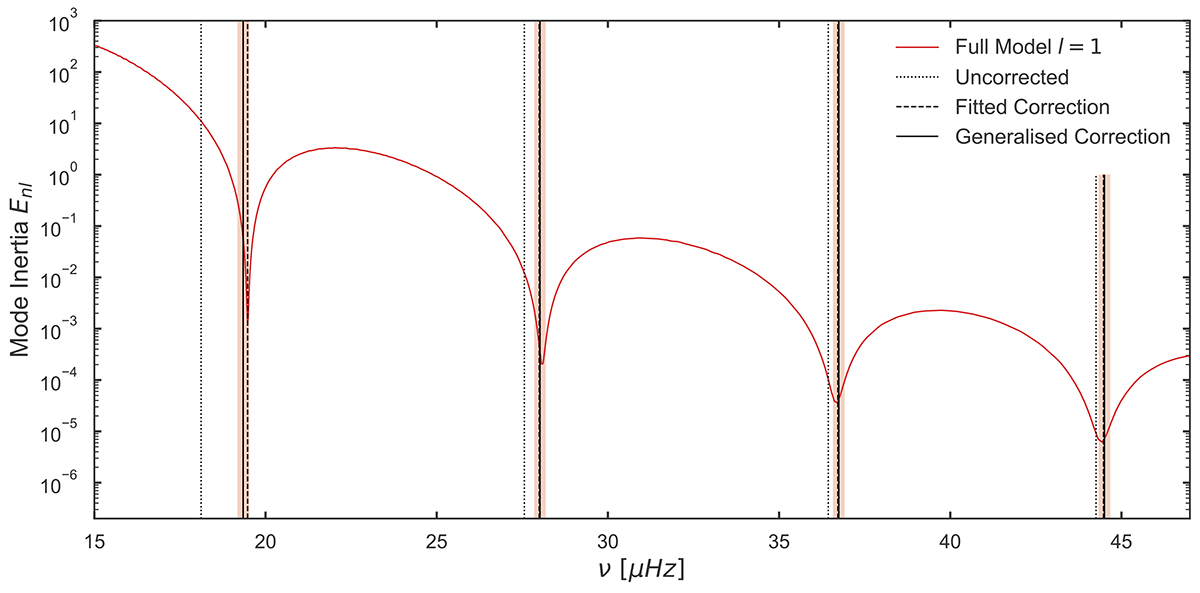
Application of the generalised frequency-shift correction for the lower frequency dipole modes of model ℳ visualised in an inertia diagram. The frequencies of the uncorrected resonance frequencies (dotted lines), corrected resonance frequencies from an exact fit to model ℳ (dashed lines) and the generalised model-corrected resonance frequencies (solid lines) are shown. Note that the exact and generalised corrections almost overlap in all acoustic resonances. The minimal size of the subsequently imposed scanning interval is indicated by the surrounding shaded bands.
Current usage metrics show cumulative count of Article Views (full-text article views including HTML views, PDF and ePub downloads, according to the available data) and Abstracts Views on Vision4Press platform.
Data correspond to usage on the plateform after 2015. The current usage metrics is available 48-96 hours after online publication and is updated daily on week days.
Initial download of the metrics may take a while.