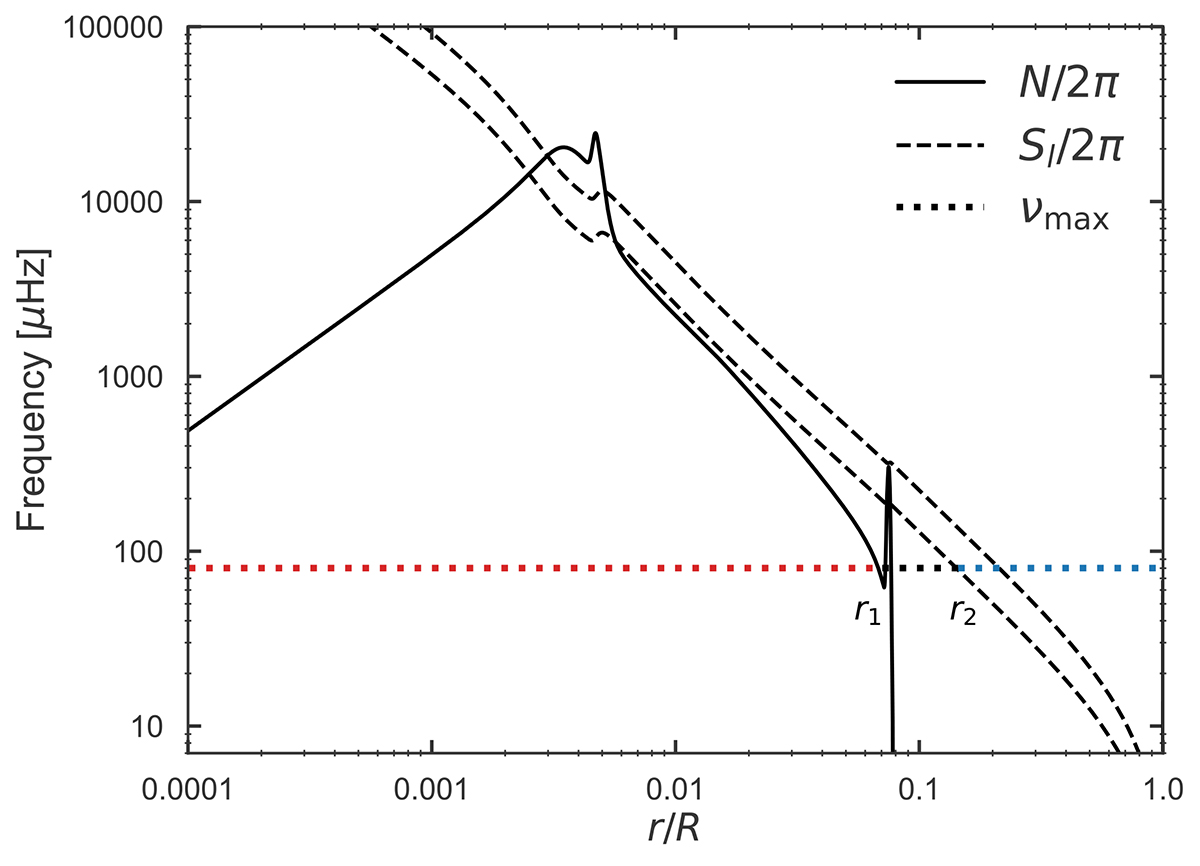
Fig. 1.
Download original image
Characteristic frequencies for model ℳ with the parameters given in Table 1, expressed in terms of cyclic frequencies N/2π (solid), S1/2π and S2/2π (both dashed, S2 residing further from the interior). The horizontal dotted line indicates the frequency of maximum power νmax. The gravity-mode cavity is indicated by the red section with its upper boundary at r1, and the pressure-mode cavity by the blue section (with the lower boundary at r2) for l = 1. A prominent buoyancy glitch can be seen at r/R ≈ 0.075.
Current usage metrics show cumulative count of Article Views (full-text article views including HTML views, PDF and ePub downloads, according to the available data) and Abstracts Views on Vision4Press platform.
Data correspond to usage on the plateform after 2015. The current usage metrics is available 48-96 hours after online publication and is updated daily on week days.
Initial download of the metrics may take a while.