Fig. 8.
Download original image
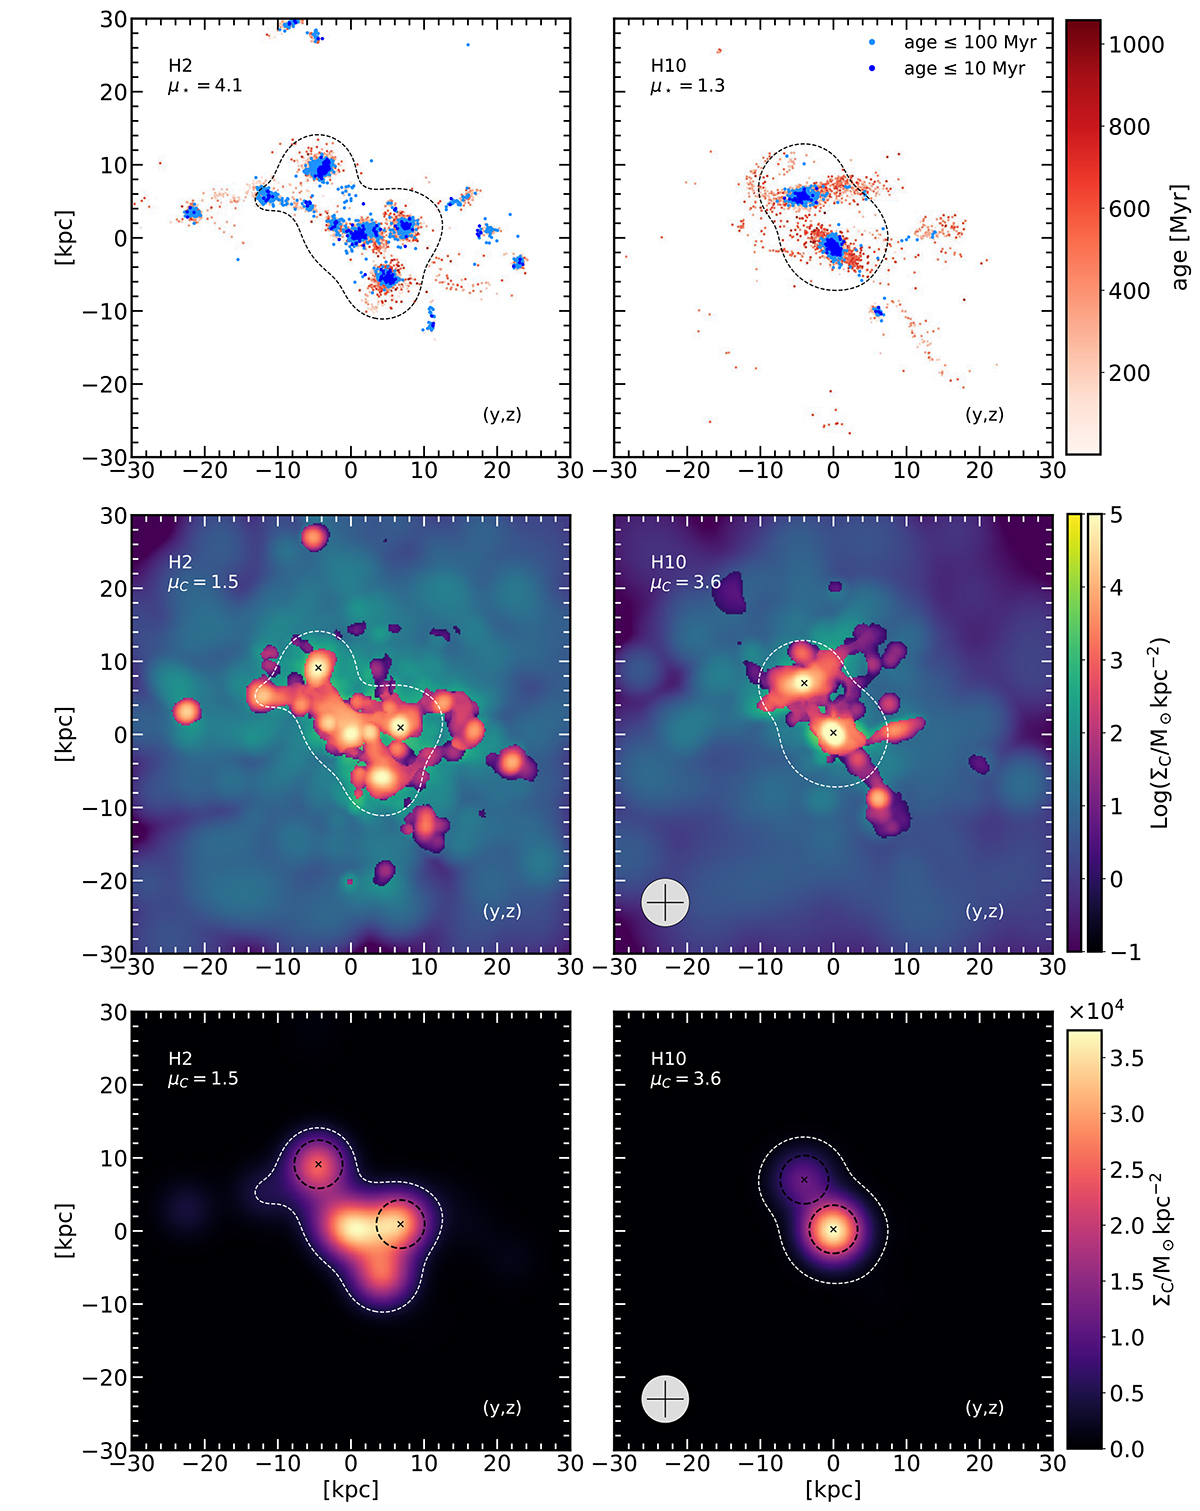
Properties of two synthetic merging systems with high (μ⋆ = 4.1, H2, left panels) and low (μ⋆ = 1.3, H10, right panels) stellar mass ratios at z = 4.5. First row: Maps of the stellar surface density projected along a line-of-sight parallel to the x-axis. Stellar particles are color-coded according to their age, with age ≤ 10 Myr in dark blue, age ≤ 100 Myr in light blue, and 100 Myr < age ≤ 1 Gyr in red color scale. Second row: Same as above, but for the carbon surface density distribution of H10 (μC = 3.6) and H2 (μC = 1.5), respectively. The green color map shows the total carbon surface density distribution and overplotted on that, in orange tones, is the carbon distribution in the cold gas phase (i.e., with T < 5 × 10⁴ K). Third row: Carbon in the cold gas phase surface density distribution once we convolve the original simulated map with the ALMA PSF. Black ellipses indicate the FWHM-based apertures used to extract the carbon content associated with each merging galaxy. In the bottom left corner is a beam of ∼1″ as a reference. Black (first row) and white (second and third rows) dashed contours indicate the positive significant level at 2σ.
Current usage metrics show cumulative count of Article Views (full-text article views including HTML views, PDF and ePub downloads, according to the available data) and Abstracts Views on Vision4Press platform.
Data correspond to usage on the plateform after 2015. The current usage metrics is available 48-96 hours after online publication and is updated daily on week days.
Initial download of the metrics may take a while.