Fig. 7.
Download original image
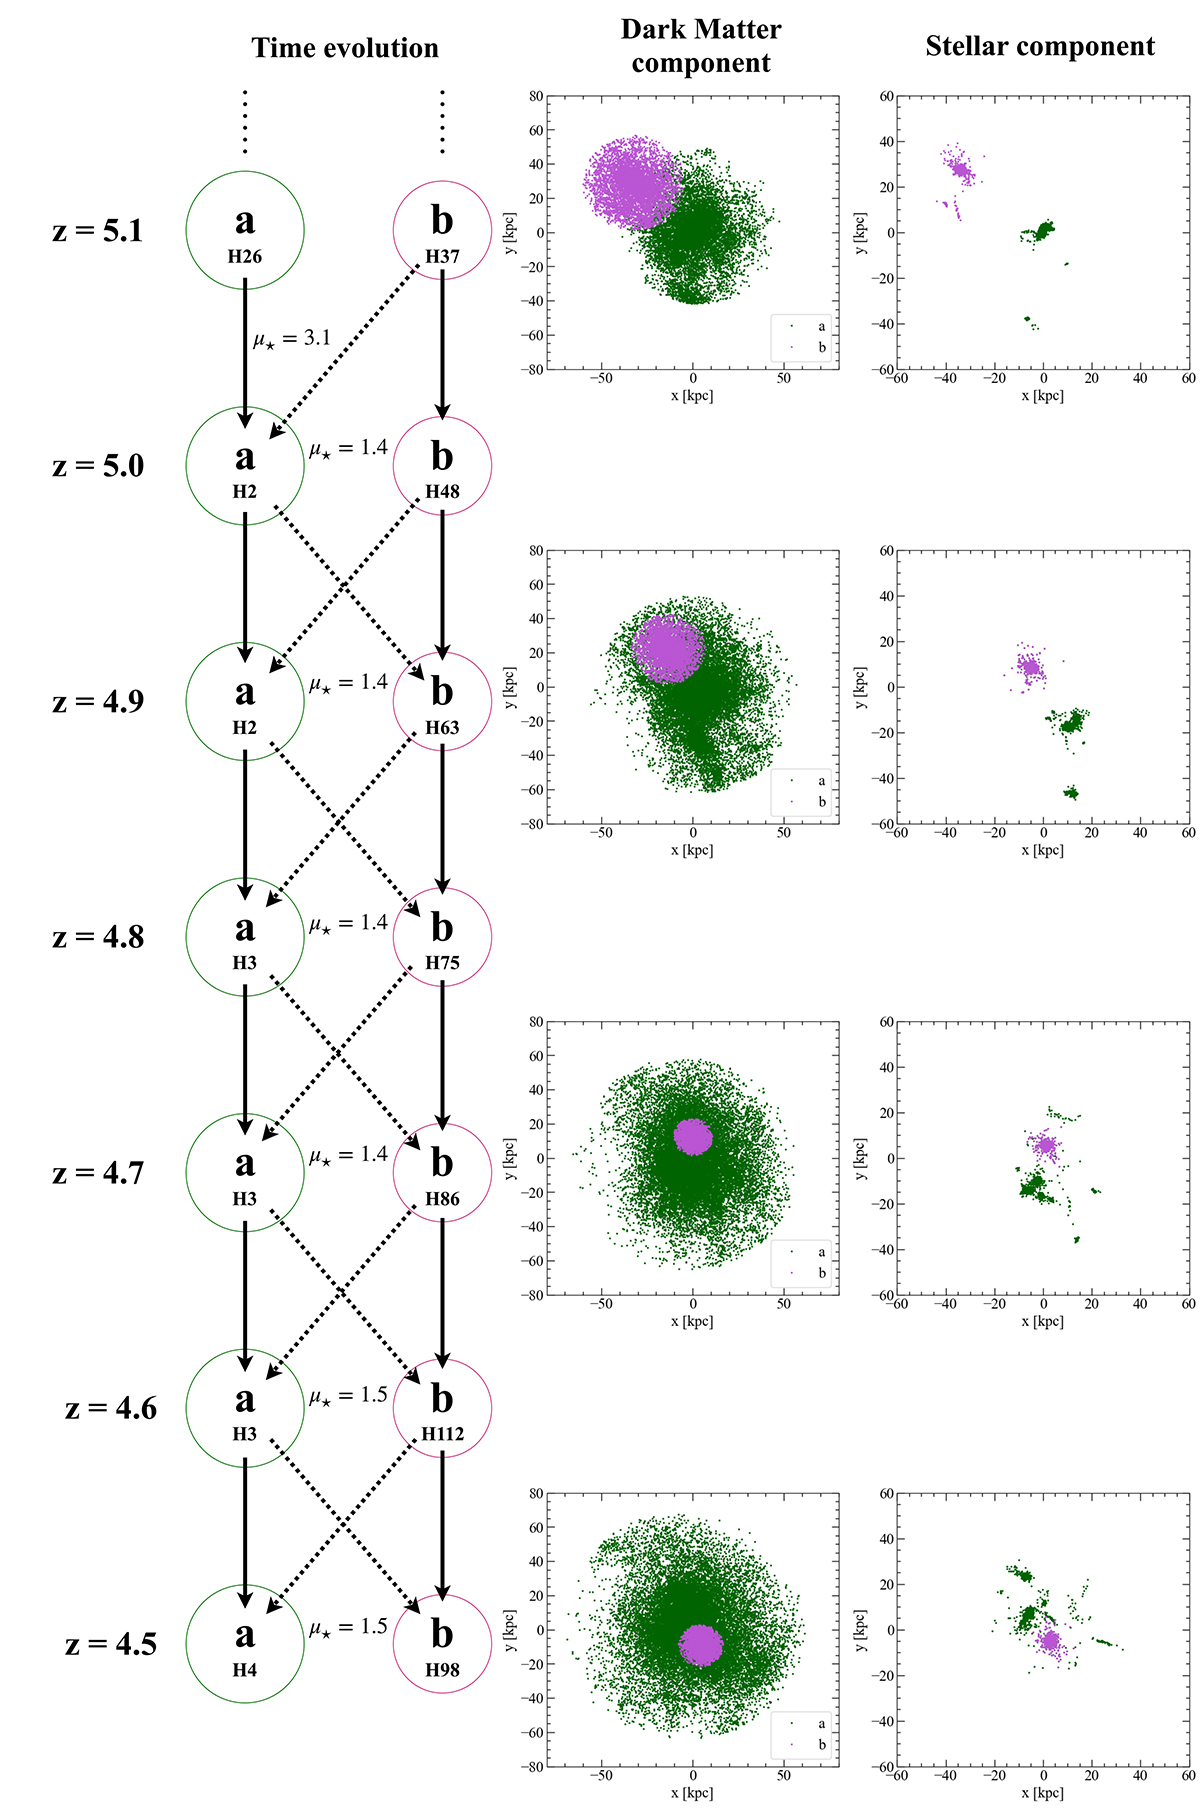
History of two merging galaxies, H4 and H98 (dubbed as “a” and “b”) shown in the left panel, reconstructed along their past merger tree, starting from z = 4.5 up to z = 5.1. At each redshift, we show both the main progenitor (black solid line) and secondary progenitor (black dashed lines), we also report the stellar mass ratio μ⋆ of the primary (green) and secondary (magenta) merging galaxies. In the middle and right panels, we show the projection on the (x, y) plane of the merging galaxies as seen in dark matter and baryonic matter components, respectively. For the sake of clarity, we only show the maps at four redshift steps (z = 5.1, 4.9, 4.7, and 4.5, from top to bottom) and galaxies are color-coded the same way as in the merger tree.
Current usage metrics show cumulative count of Article Views (full-text article views including HTML views, PDF and ePub downloads, according to the available data) and Abstracts Views on Vision4Press platform.
Data correspond to usage on the plateform after 2015. The current usage metrics is available 48-96 hours after online publication and is updated daily on week days.
Initial download of the metrics may take a while.