Fig. 3.
Download original image
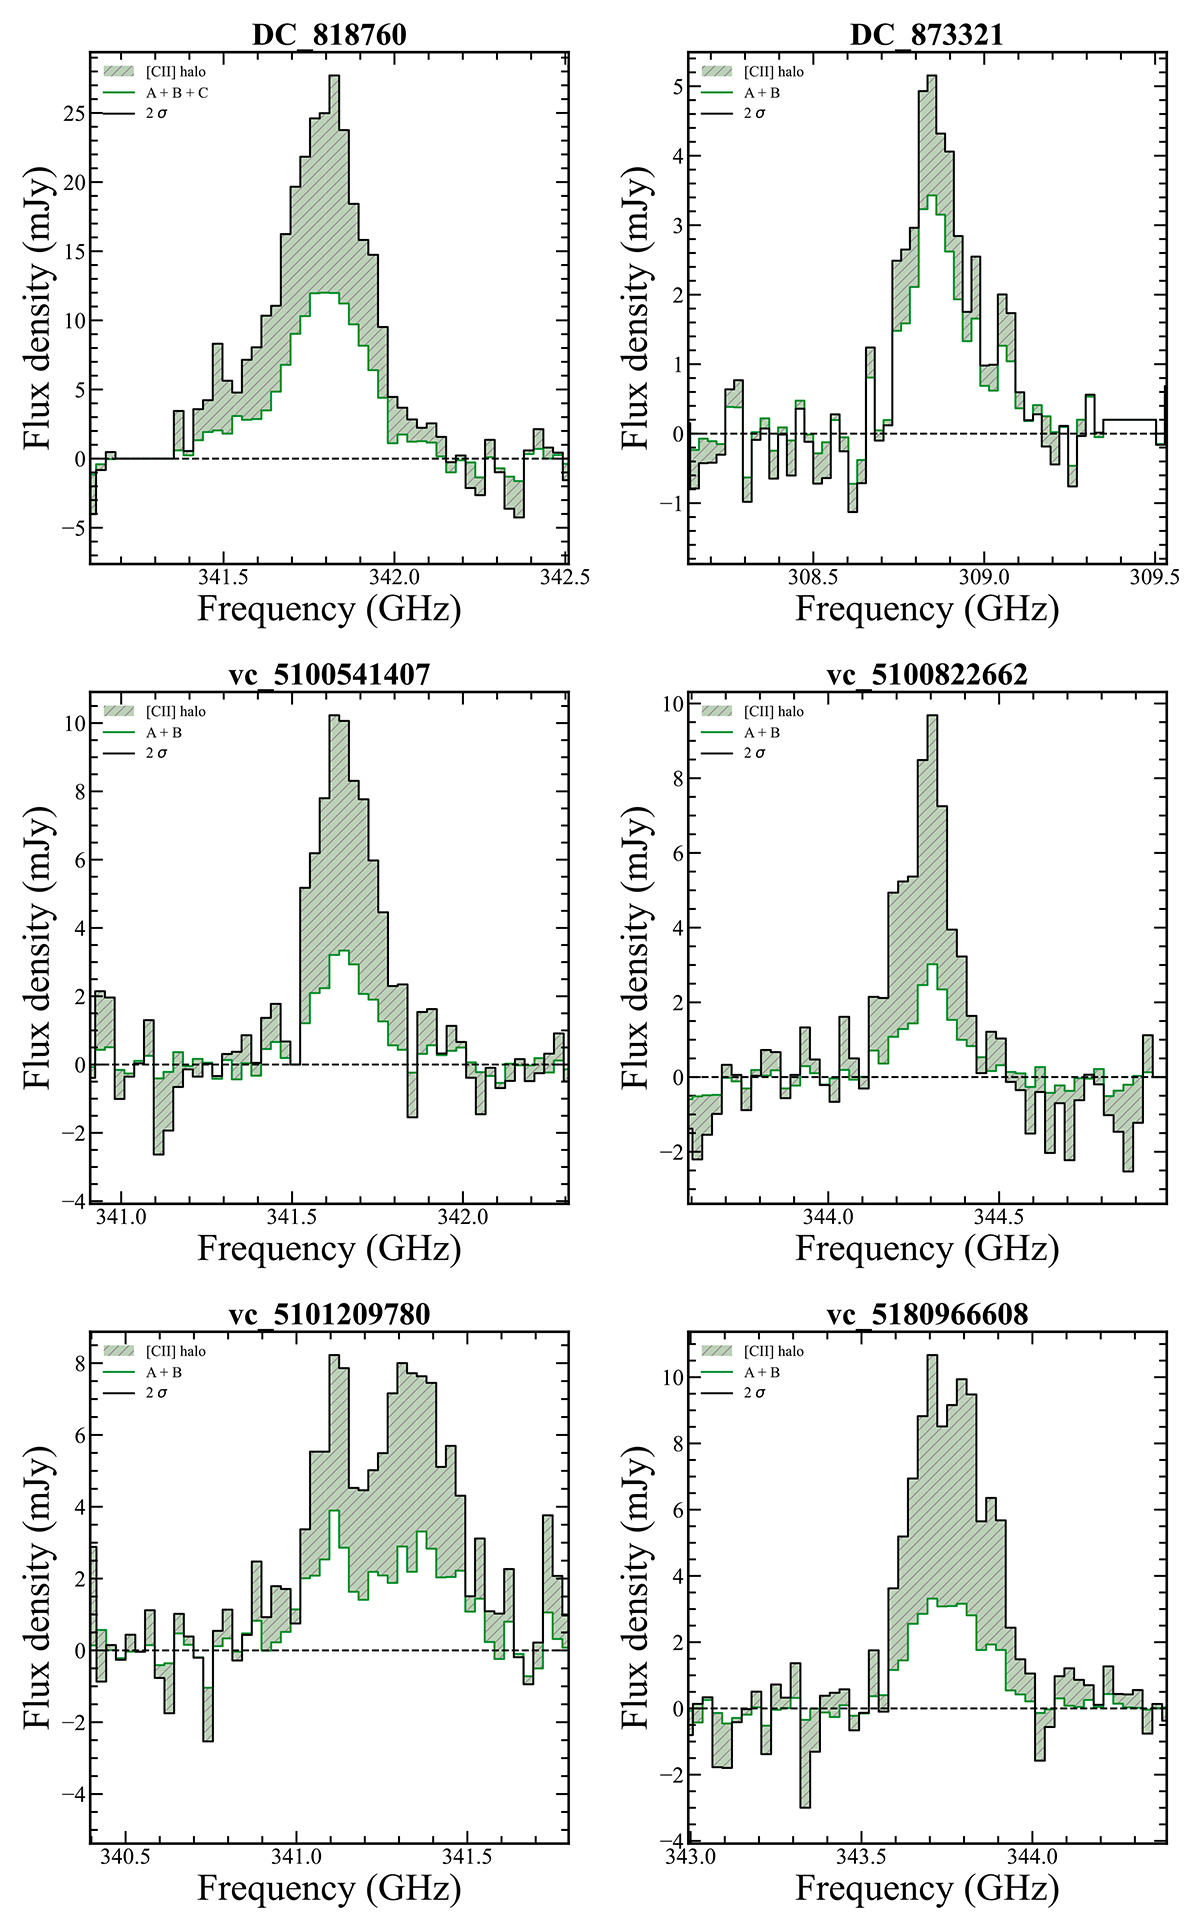
[CII] flux density in mJy as a function of frequency (GHz) for the galaxies in our sample. Black lines are the total [CII] emission arising from the full system (galaxy + diffuse [CII] halo) and green solid lines are the sum of the emissions coming from each component of the merging system when we consider the FWHMx × FWHMy aperture. Green hatched areas show the emission coming from the diffuse [CII] halo and the [CII] fraction is in green boxes (see Sect. 3 for the definition of this quantity and discussion).
Current usage metrics show cumulative count of Article Views (full-text article views including HTML views, PDF and ePub downloads, according to the available data) and Abstracts Views on Vision4Press platform.
Data correspond to usage on the plateform after 2015. The current usage metrics is available 48-96 hours after online publication and is updated daily on week days.
Initial download of the metrics may take a while.