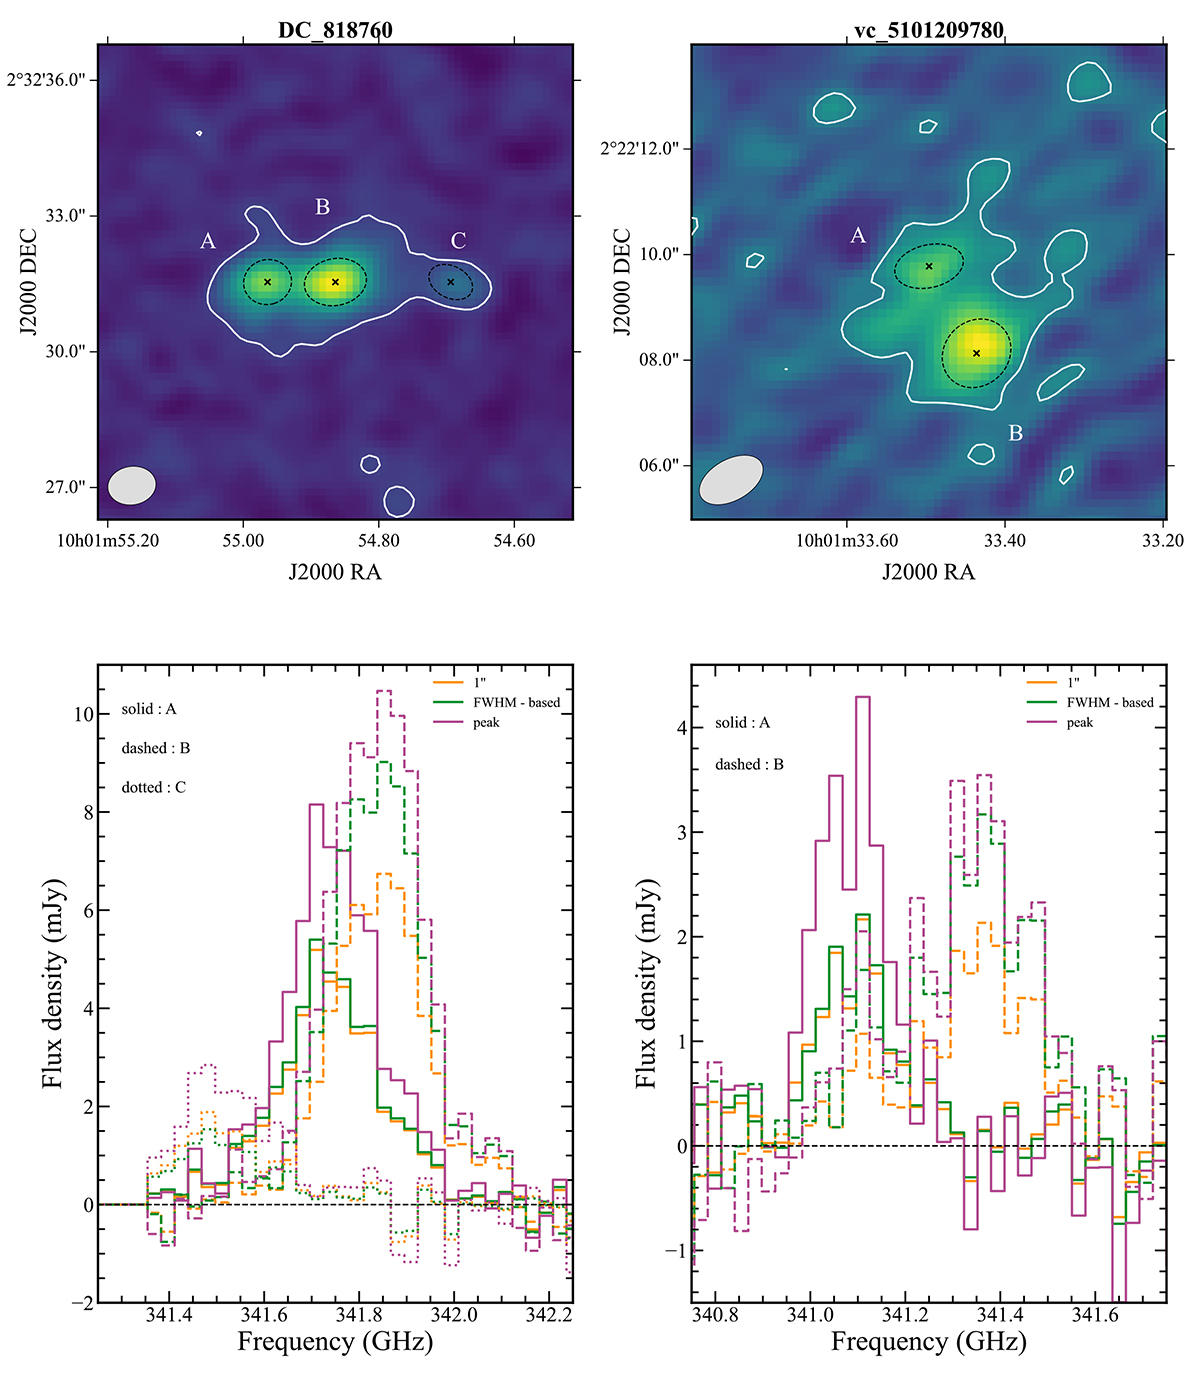
Fig. 2.
Download original image
Same as Fig. 1, but for two specific systems: (a) DC_818760 (top-left) and (b) vc_5101209780 (top-right). The white contour indicates the positive significant level at 2σ of [CII] flux, where σ[CII] = 84 mJy km/s in (a) and σ[CII] = 95 mJy km/s in (b). The dashed black ellipses indicate the FWHMx × FWHMy regions obtained by 2D Gaussian models and correspond to the apertures used to extract the [CII] spectra of (a) and (b). Finally, the black crosses mark the center of each ellipse (i.e., center of each galaxy). The ALMA beam size is given in the bottom-left corners. The lower panel shows the [CII] spectra for each component of the merging system (different line styles) extracted using 1″ (orange), FWHM-based (green), and peak apertures (pink).
Current usage metrics show cumulative count of Article Views (full-text article views including HTML views, PDF and ePub downloads, according to the available data) and Abstracts Views on Vision4Press platform.
Data correspond to usage on the plateform after 2015. The current usage metrics is available 48-96 hours after online publication and is updated daily on week days.
Initial download of the metrics may take a while.