Open Access
Fig. C.1.
Download original image
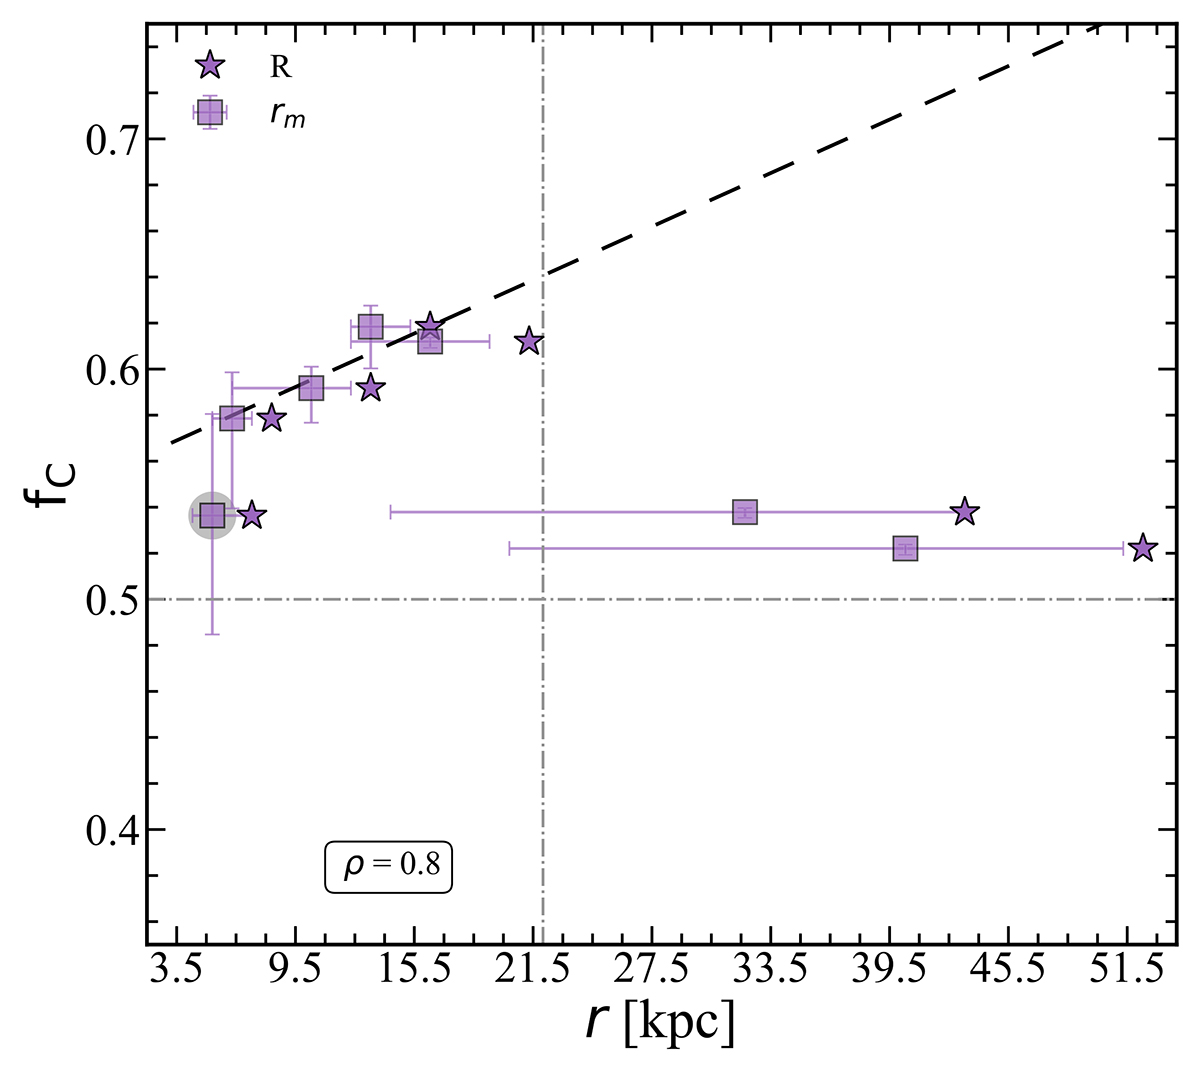
Fraction of carbon mass in the cold gas phase as a function of the mean distance (rm, violet square) and physical distance (R, violet stars) between the galaxies. The horizontal and vertical gray dot-dashed lines show the fC = 0.5 value and r = 21.5 kpc, the maximum value for the x-axis in Fig. 5, respectively.
Current usage metrics show cumulative count of Article Views (full-text article views including HTML views, PDF and ePub downloads, according to the available data) and Abstracts Views on Vision4Press platform.
Data correspond to usage on the plateform after 2015. The current usage metrics is available 48-96 hours after online publication and is updated daily on week days.
Initial download of the metrics may take a while.