Fig. B.1.
Download original image
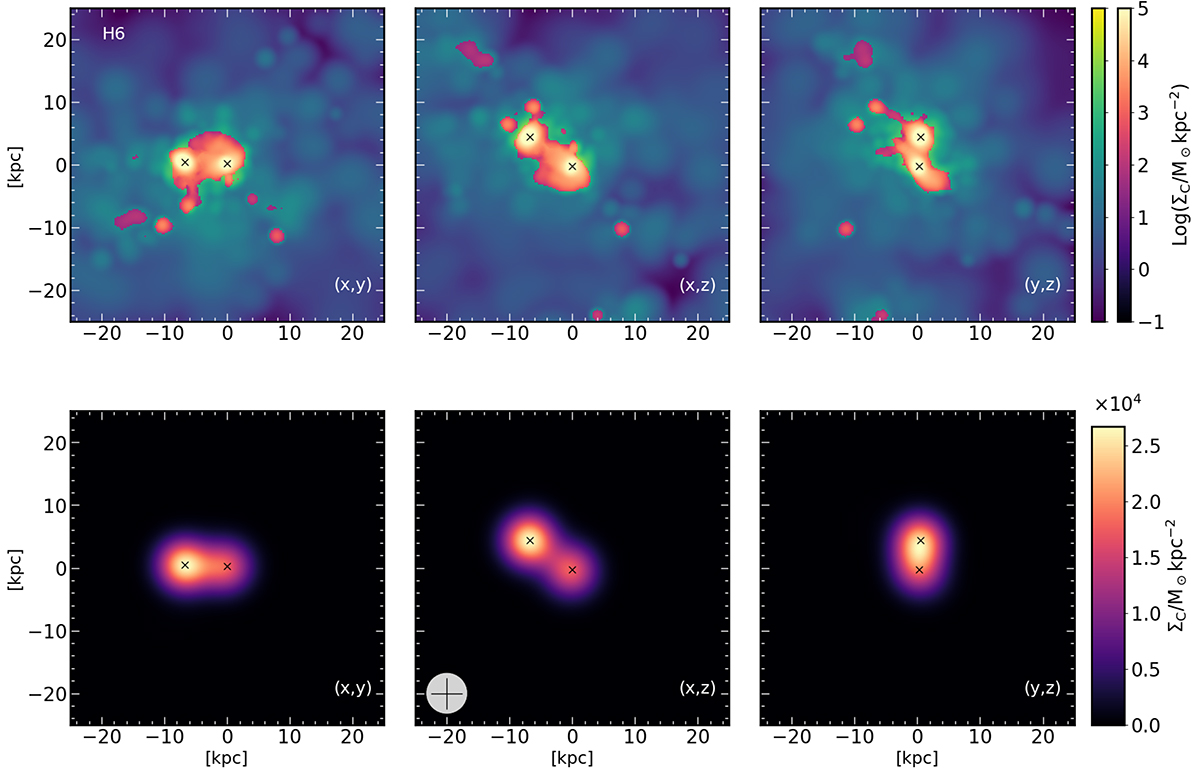
Carbon surface density distribution in the synthetic merging system H6, each column is a projection. Top row: Green color map showing the total surface density distribution of carbon. Overplotted in orange tones is the carbon distribution in the cold gas phase (T < 5 × 10⁴ K). Bottom row: Surface density distribution of carbon once we convolve the original map with the ALPINE-ALMA PSF. Black crosses indicate each merging galaxy and in the bottom left corner is a beam of ∼1” as a reference. The x-projection in the bottom-right panel shows that it is difficult to discriminate between the two interacting galaxies.
Current usage metrics show cumulative count of Article Views (full-text article views including HTML views, PDF and ePub downloads, according to the available data) and Abstracts Views on Vision4Press platform.
Data correspond to usage on the plateform after 2015. The current usage metrics is available 48-96 hours after online publication and is updated daily on week days.
Initial download of the metrics may take a while.