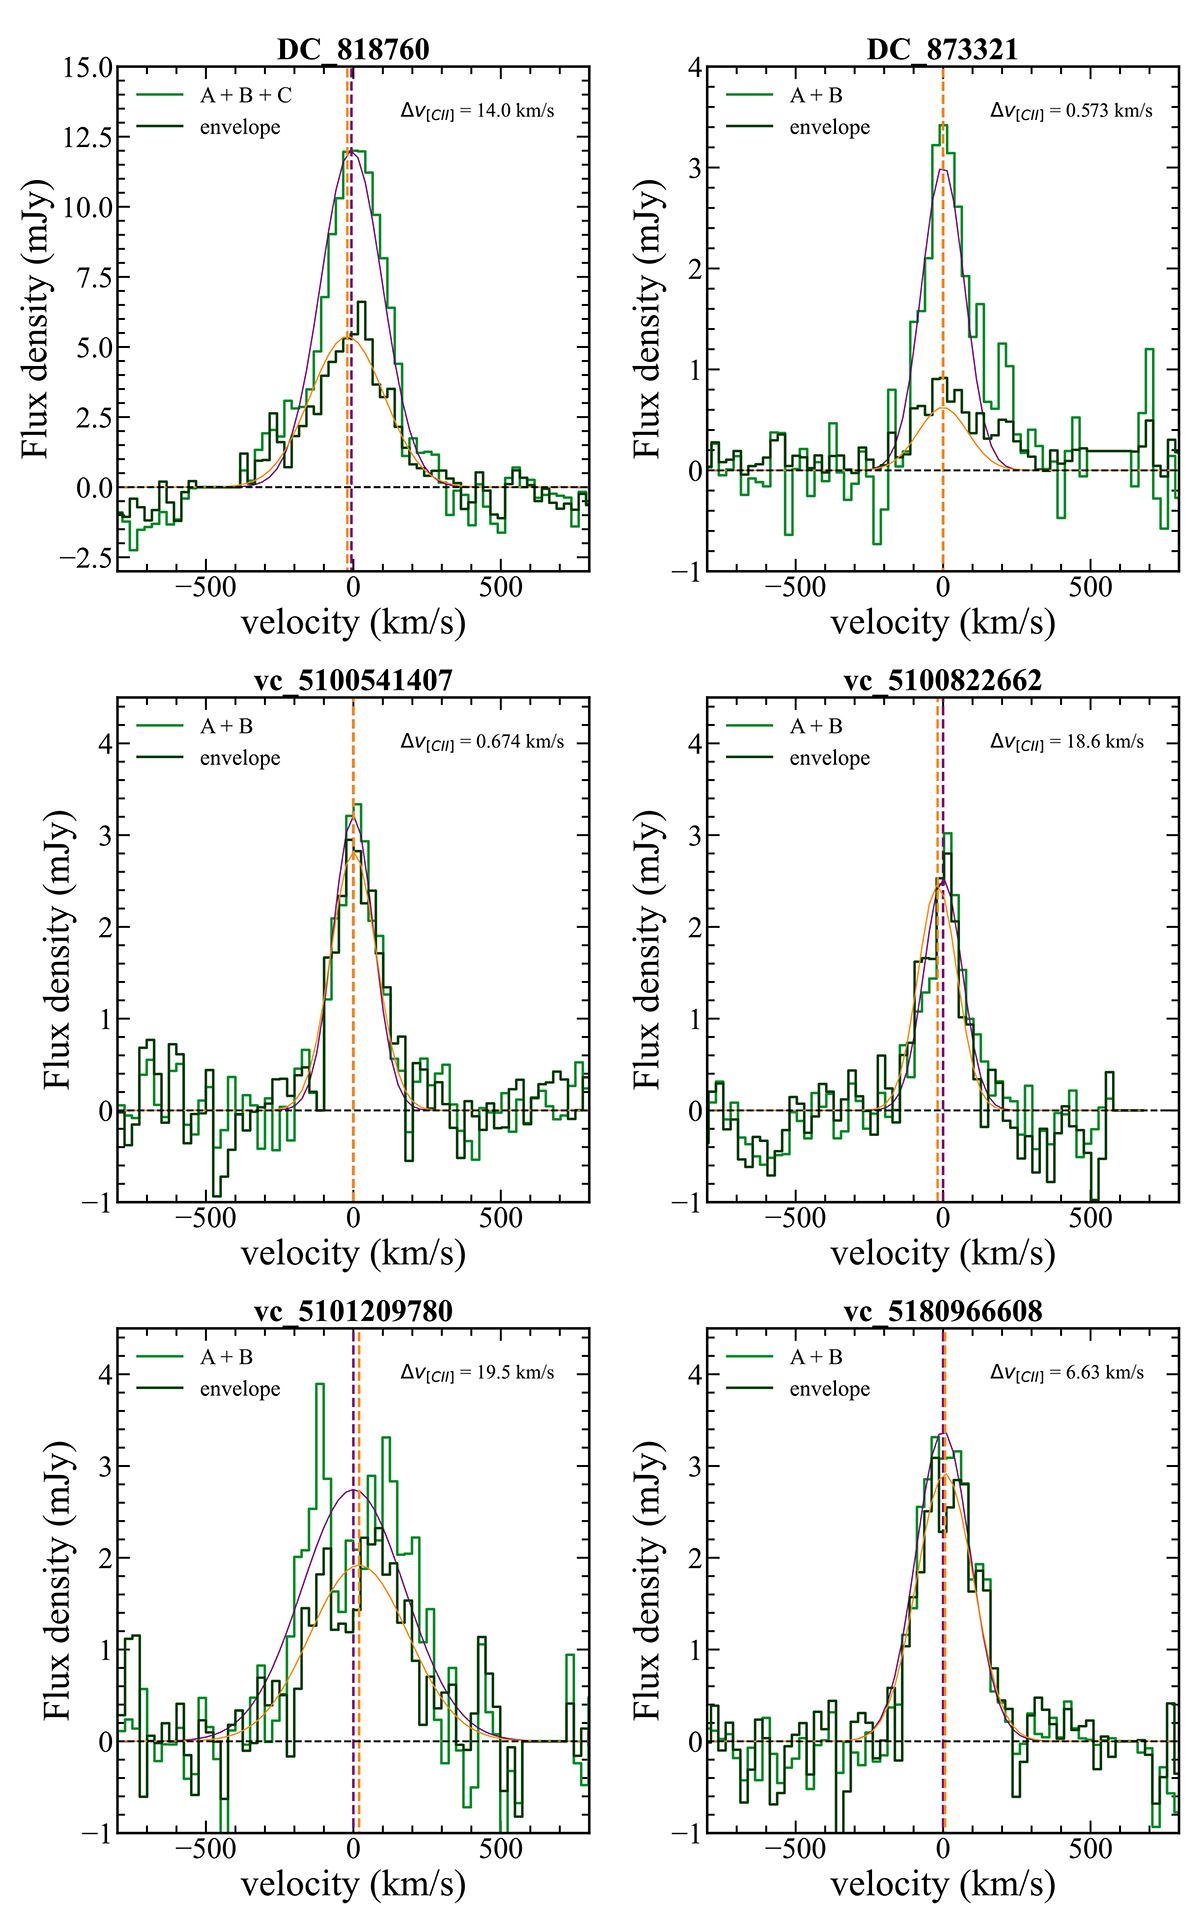
Fig. A.1.
Download original image
[CII] flux density (mJy) as a function of velocity (km/s) for our observational sample. The [CII] emission from the diffuse gas (i.e., envelope) is depicted in dark green, while in light green is the emission associated with the galaxies - assuming the FWHM-based aperture case. The emission associated with the envelope has been corrected for the 0.58 factor which takes into account that part of the emission can attributed to the tails of the PSF (see Sect. 3 for a discussion). Gaussian fits for the emission associated with the diffuse gas component and galactic one are in orange and pink respectively. The dashed vertical lines show the central values of the Gaussian fits. The velocity shift (Δv[CII]) between these two components is displayed on the top right side of each panel.
Current usage metrics show cumulative count of Article Views (full-text article views including HTML views, PDF and ePub downloads, according to the available data) and Abstracts Views on Vision4Press platform.
Data correspond to usage on the plateform after 2015. The current usage metrics is available 48-96 hours after online publication and is updated daily on week days.
Initial download of the metrics may take a while.