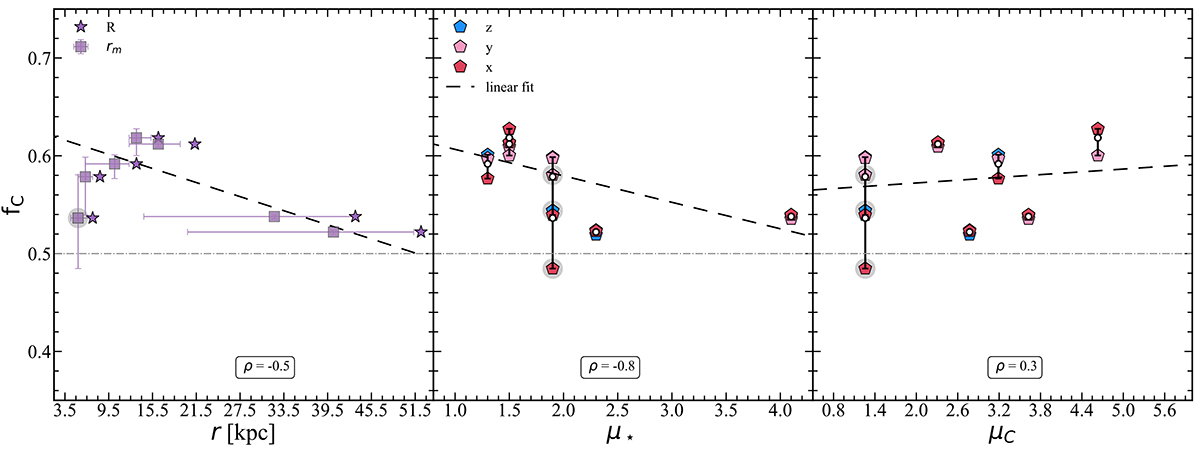
Fig. 10.
Download original image
Trends between the fraction of carbon mass in the cold gas phase (T < 5 × 10⁴ K) in the diffuse halo (fC) and the distance (r) between the galaxies (left), the stellar mass ratio (μ⋆, middle), and the carbon mass ratio (μC, right). In particular, on the left, we show favg (i.e., the average among the three projections) as a function of both the distance averaged on the three projections (rm, violet squares) and the physical distance between the galaxies (R, violet stars). In the middle and right panels, different colors refer to fC estimated by projecting the carbon surface density along the lines of sight parallel to the z (blue), y (pink), and x (red) axis. In each panel, white dots are favg, the black line is the linear fit considering favg versus rm, μ⋆, μC, respectively. We also specify the Spearman coefficient (ρ) of each relation. H2 is not included in these plots as this system is characterized by an out-of-scale value of fC = 0.8 and H6 is highlighted in gray. The horizontal gray dot-dashed line shows the value of fC = 0.5.
Current usage metrics show cumulative count of Article Views (full-text article views including HTML views, PDF and ePub downloads, according to the available data) and Abstracts Views on Vision4Press platform.
Data correspond to usage on the plateform after 2015. The current usage metrics is available 48-96 hours after online publication and is updated daily on week days.
Initial download of the metrics may take a while.