Open Access
Fig. 9
Download original image
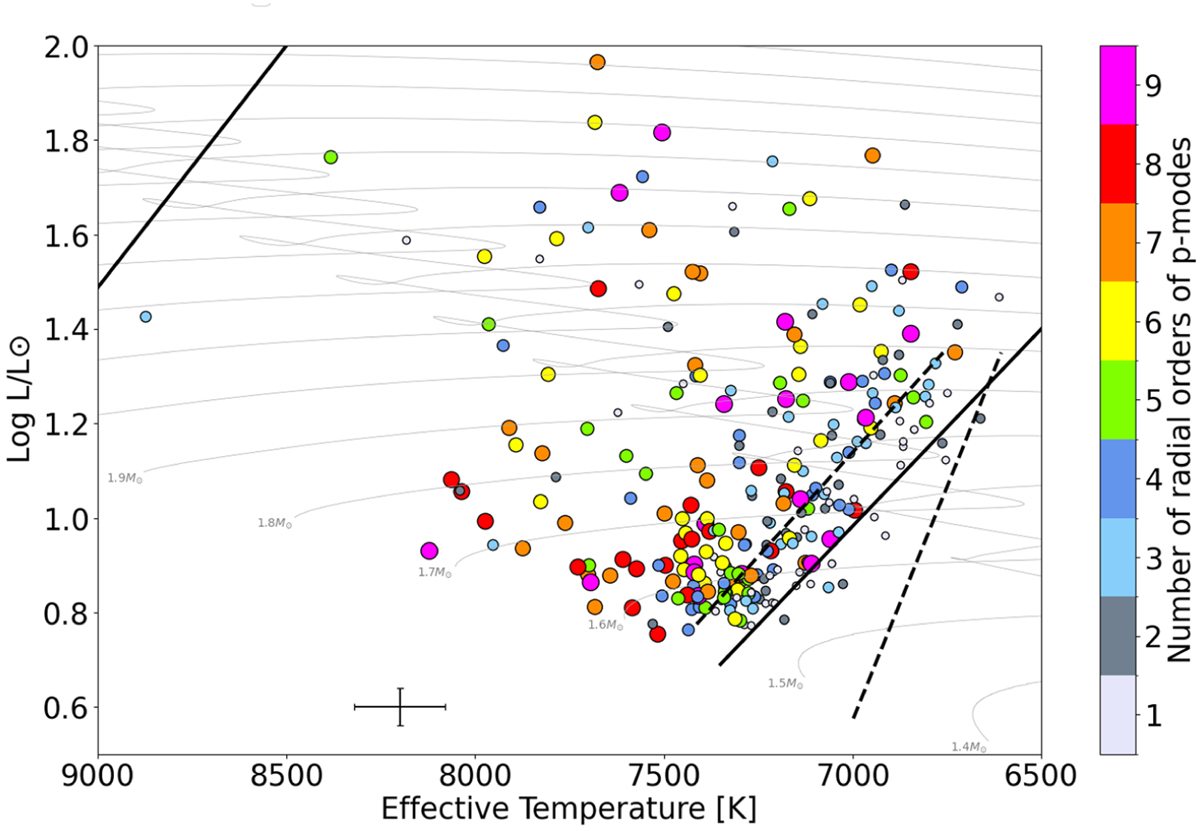
HR diagram showing the observed number of excited radial orders for each star hosting p modes. The instability strips and evolutionary tracks are the same as those shown in Fig. 6. The typical uncertainties for Teff and luminosity are shown in the lower left part of the plot.
Current usage metrics show cumulative count of Article Views (full-text article views including HTML views, PDF and ePub downloads, according to the available data) and Abstracts Views on Vision4Press platform.
Data correspond to usage on the plateform after 2015. The current usage metrics is available 48-96 hours after online publication and is updated daily on week days.
Initial download of the metrics may take a while.