Fig. 8
Download original image
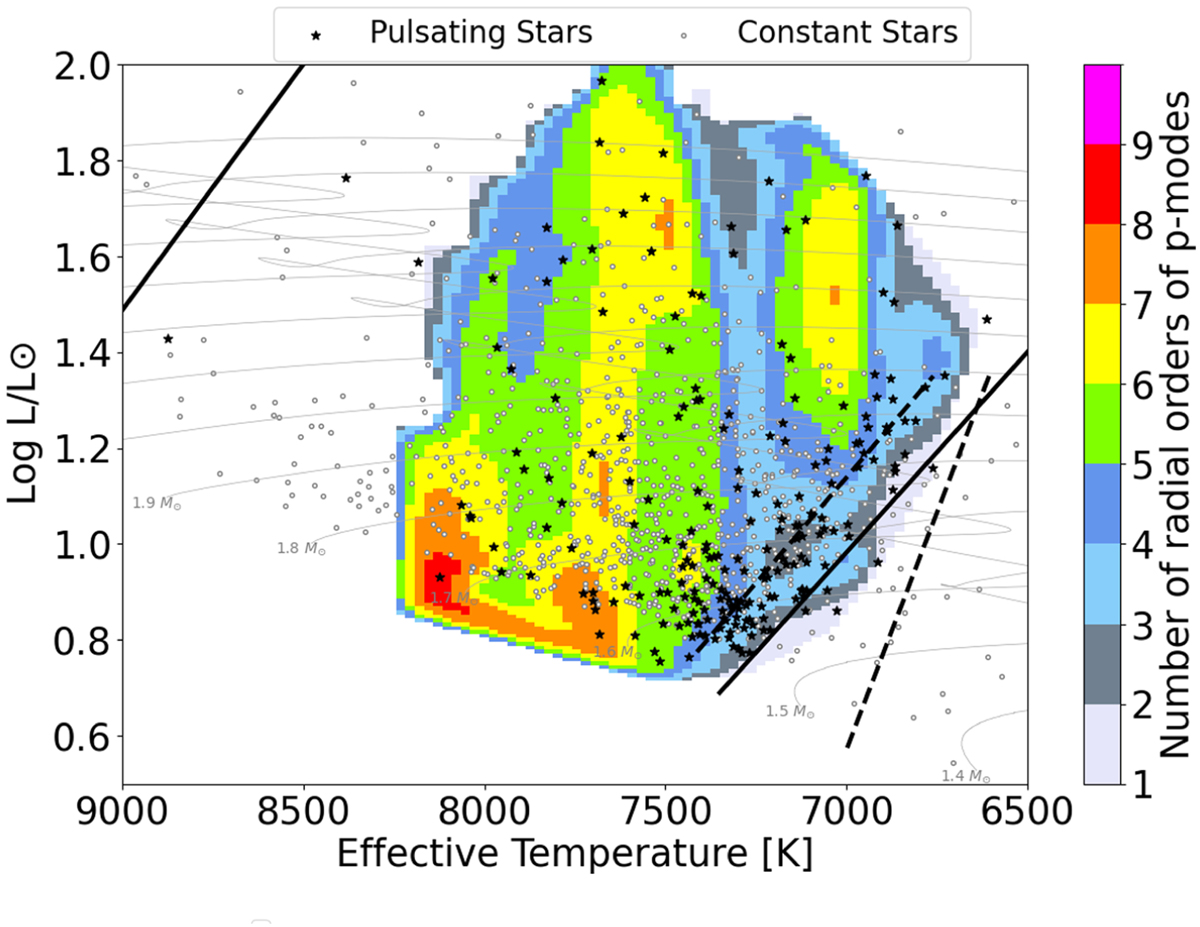
Distribution of radial order excitation in the HR diagram for our pulsating Am and Fm stars. The map shows the estimated number of radial orders excited. Nonpulsating stars are shown in white circles, while our sample of pulsating stars are seen as black stars. The instability strips and evolutionary tracks are the same as those shown in Fig. 6.
Current usage metrics show cumulative count of Article Views (full-text article views including HTML views, PDF and ePub downloads, according to the available data) and Abstracts Views on Vision4Press platform.
Data correspond to usage on the plateform after 2015. The current usage metrics is available 48-96 hours after online publication and is updated daily on week days.
Initial download of the metrics may take a while.