Fig. 7
Download original image
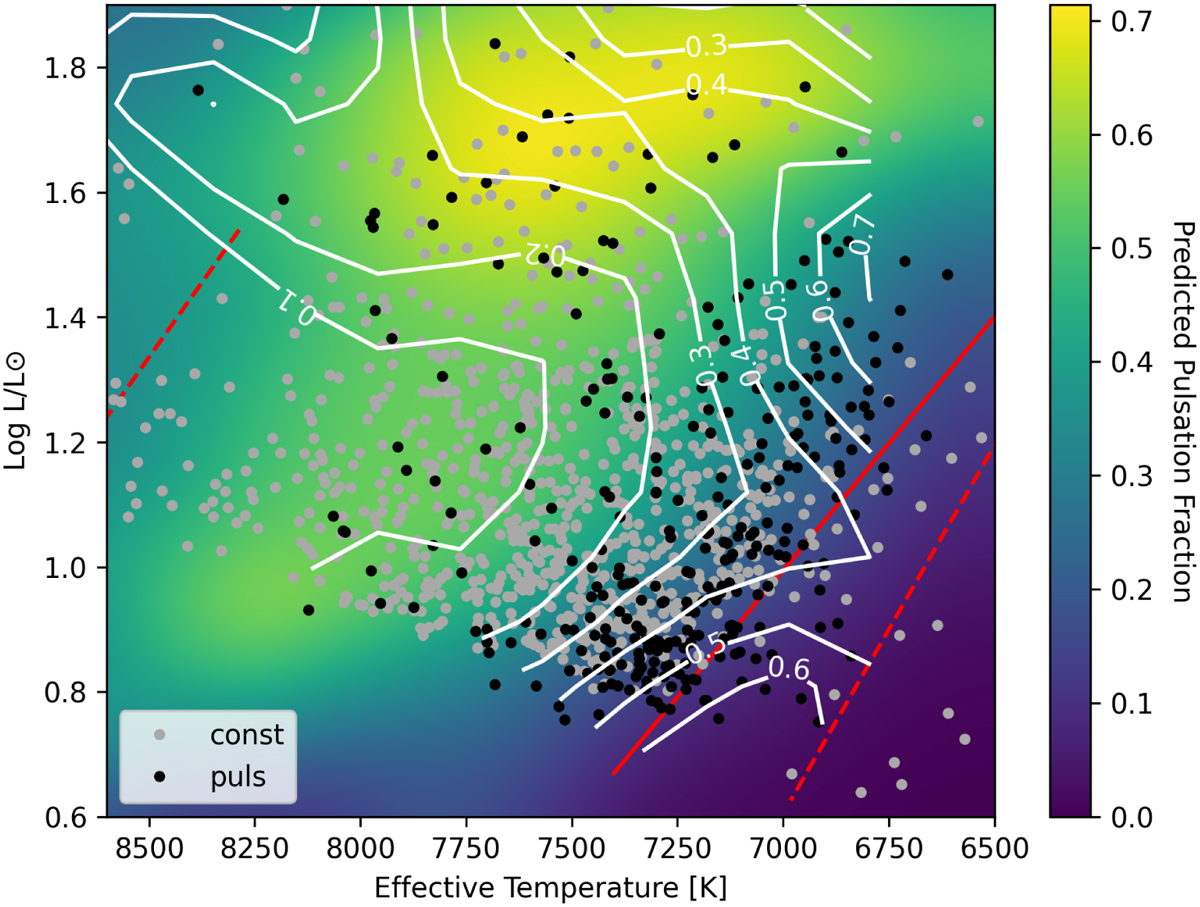
Heat map representing the predicted pulsation fraction for all A and F stars from Murphy et al. (2019). The black dots are Am and Fm stars found to exhibit δ Sct pulsations, while the those without known pulsations are shown in light grey. The white contours indicate the observed Am and Fm star pulsator fraction. Theoretical instability strip boundaries from Dupret et al. (2004), for α = 2, are show as dashed lines, while the red-edge given by Murphy et al. (2019) is shown as a solid red line. The typical uncertainties for Teff and luminosity are the same as in the previous figures.
Current usage metrics show cumulative count of Article Views (full-text article views including HTML views, PDF and ePub downloads, according to the available data) and Abstracts Views on Vision4Press platform.
Data correspond to usage on the plateform after 2015. The current usage metrics is available 48-96 hours after online publication and is updated daily on week days.
Initial download of the metrics may take a while.