Fig. 4
Download original image
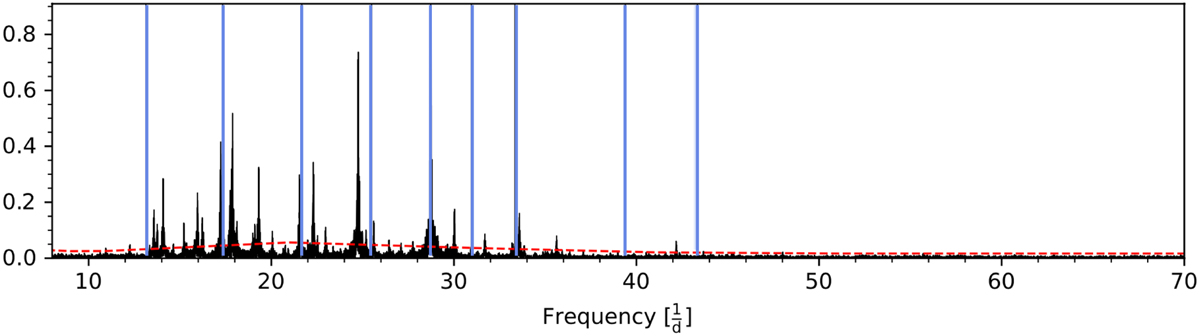
Example amplitude spectrum of a star for which frequency extraction did not yield any results. The vertical blue lines spanning the entire window show the location of the predicted radial orders. The red dashed line shows the S /N = 4 line, computed as a sliding window. This star was upon visual inspection included in the sample and conditions were loosened in order to extract frequencies for it.
Current usage metrics show cumulative count of Article Views (full-text article views including HTML views, PDF and ePub downloads, according to the available data) and Abstracts Views on Vision4Press platform.
Data correspond to usage on the plateform after 2015. The current usage metrics is available 48-96 hours after online publication and is updated daily on week days.
Initial download of the metrics may take a while.