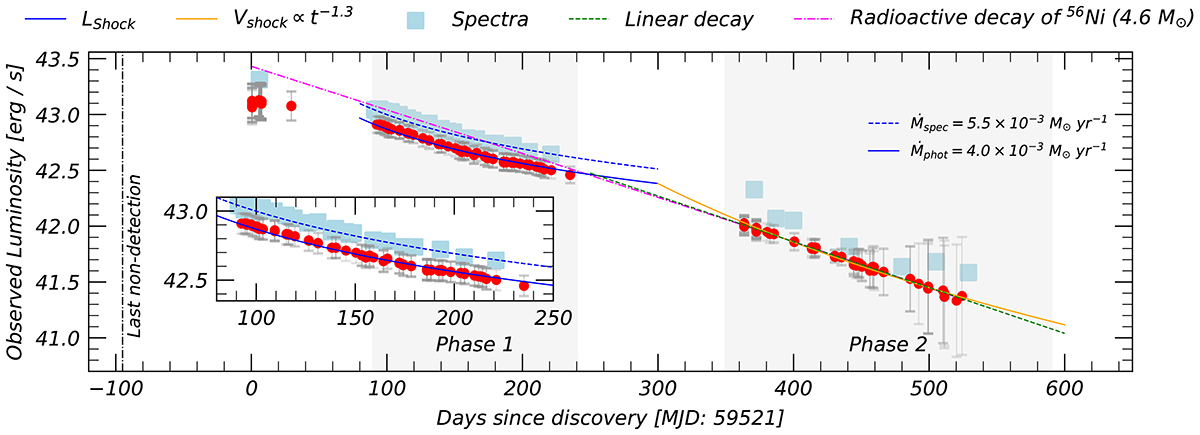
Fig. 26.
Download original image
Pseudo-bolometric light curve of SN 2021adxl. The best fitting model from Eq. (2) fitting to Phase 1 photometry (spectra) is given as the solid (dashed) blue line. Included in the inset is a zoomed-in image of this phase. Both a linear decline (dashed green) and possible shock luminosity curve (solid orange) is fitted to Phase 2. The magenta line is the decay expected for radioactive nickel, fitted to Phase 2, as discussed in Sect. 4.
Current usage metrics show cumulative count of Article Views (full-text article views including HTML views, PDF and ePub downloads, according to the available data) and Abstracts Views on Vision4Press platform.
Data correspond to usage on the plateform after 2015. The current usage metrics is available 48-96 hours after online publication and is updated daily on week days.
Initial download of the metrics may take a while.