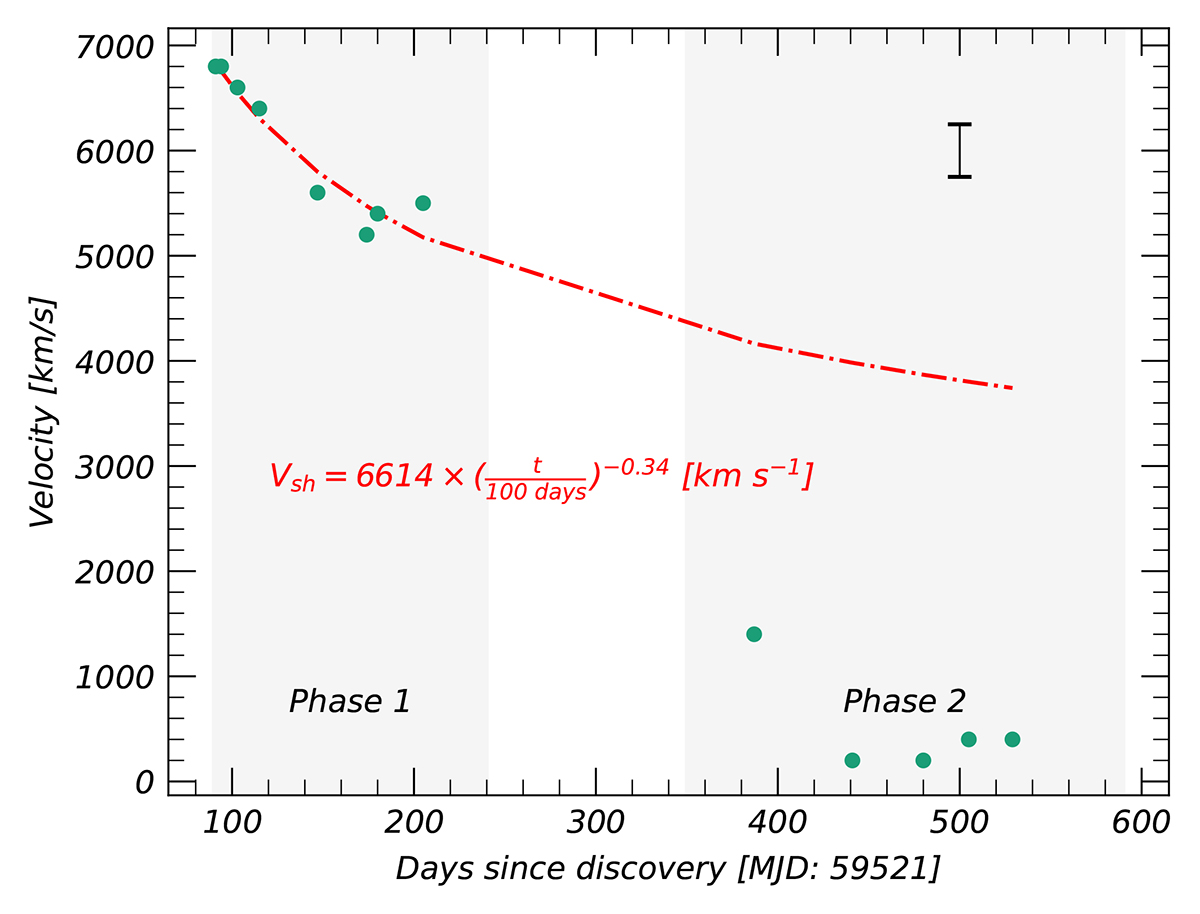
Fig. 25.
Download original image
Input velocities of the best fitting models needed to fit the Hα profile evolution. Velocities during Phase 1 are fitted with an exponential decline, given in red. During Phase 2, the velocities are lower and no longer follow the trend seen in Phase 1. This is likely due to the forward shock becoming optically thin, which is also seen in the faster decay rate in the bolometric light curve seen in Fig. 4. The error bar in the upper right denotes the velocity grid-resolution of the input spectra.
Current usage metrics show cumulative count of Article Views (full-text article views including HTML views, PDF and ePub downloads, according to the available data) and Abstracts Views on Vision4Press platform.
Data correspond to usage on the plateform after 2015. The current usage metrics is available 48-96 hours after online publication and is updated daily on week days.
Initial download of the metrics may take a while.