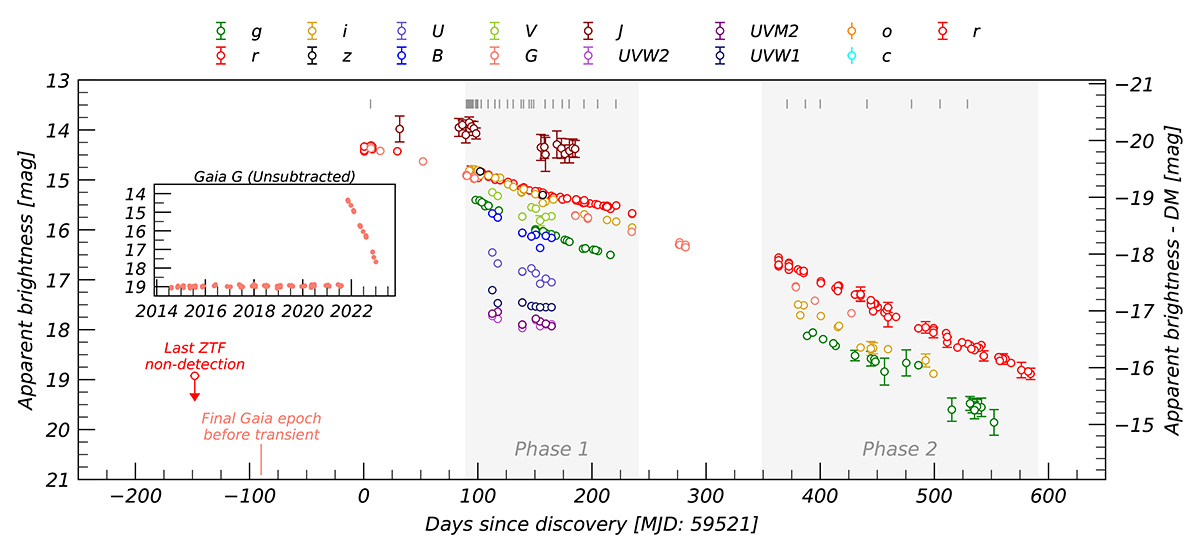
Fig. 2.
Download original image
Multi-band light curve of SN 2021adxl covering ∼1.6 years of its post-peak evolution. Highlighted in gray are two distinct phases where SN 2021adxl displays two distinct decline slopes, as mentioned in the text. The inset provides Gaia G-band data of SN 2021adxl (post-2022), as well as the historic observations of the explosion site (pre-2022, likely dominated by host flux). The right y-axis gives the apparent magnitude corrected for distance. Spectral epochs are given as vertical lines at the top of the plot.
Current usage metrics show cumulative count of Article Views (full-text article views including HTML views, PDF and ePub downloads, according to the available data) and Abstracts Views on Vision4Press platform.
Data correspond to usage on the plateform after 2015. The current usage metrics is available 48-96 hours after online publication and is updated daily on week days.
Initial download of the metrics may take a while.