Open Access
Fig. 15.
Download original image
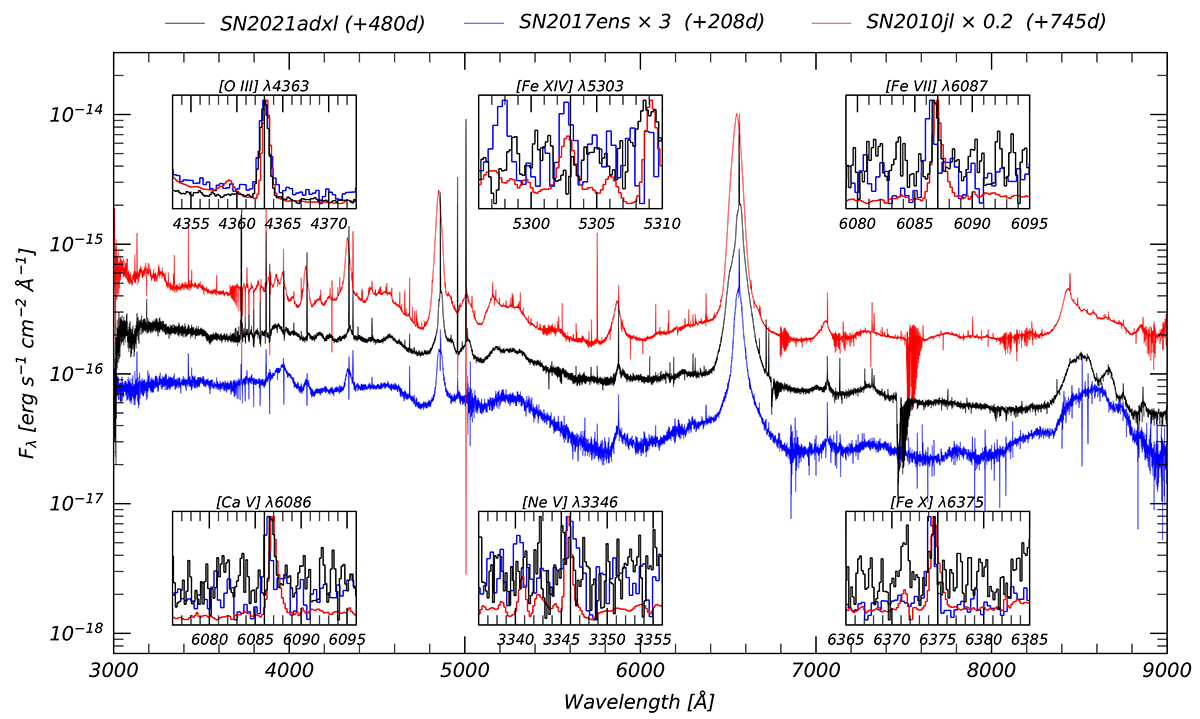
Comparison of SN 2021adxl to the Type IIn SN 2010jl (Fransson et al. 2014), as well as the transitional Type Ic-BL/IIn SN 2017ens (Chen et al. 2018). The insets highlight the wavelength range around known coronal emission lines. Each inset has been normalized to the peak of each respective emission line.
Current usage metrics show cumulative count of Article Views (full-text article views including HTML views, PDF and ePub downloads, according to the available data) and Abstracts Views on Vision4Press platform.
Data correspond to usage on the plateform after 2015. The current usage metrics is available 48-96 hours after online publication and is updated daily on week days.
Initial download of the metrics may take a while.