Open Access
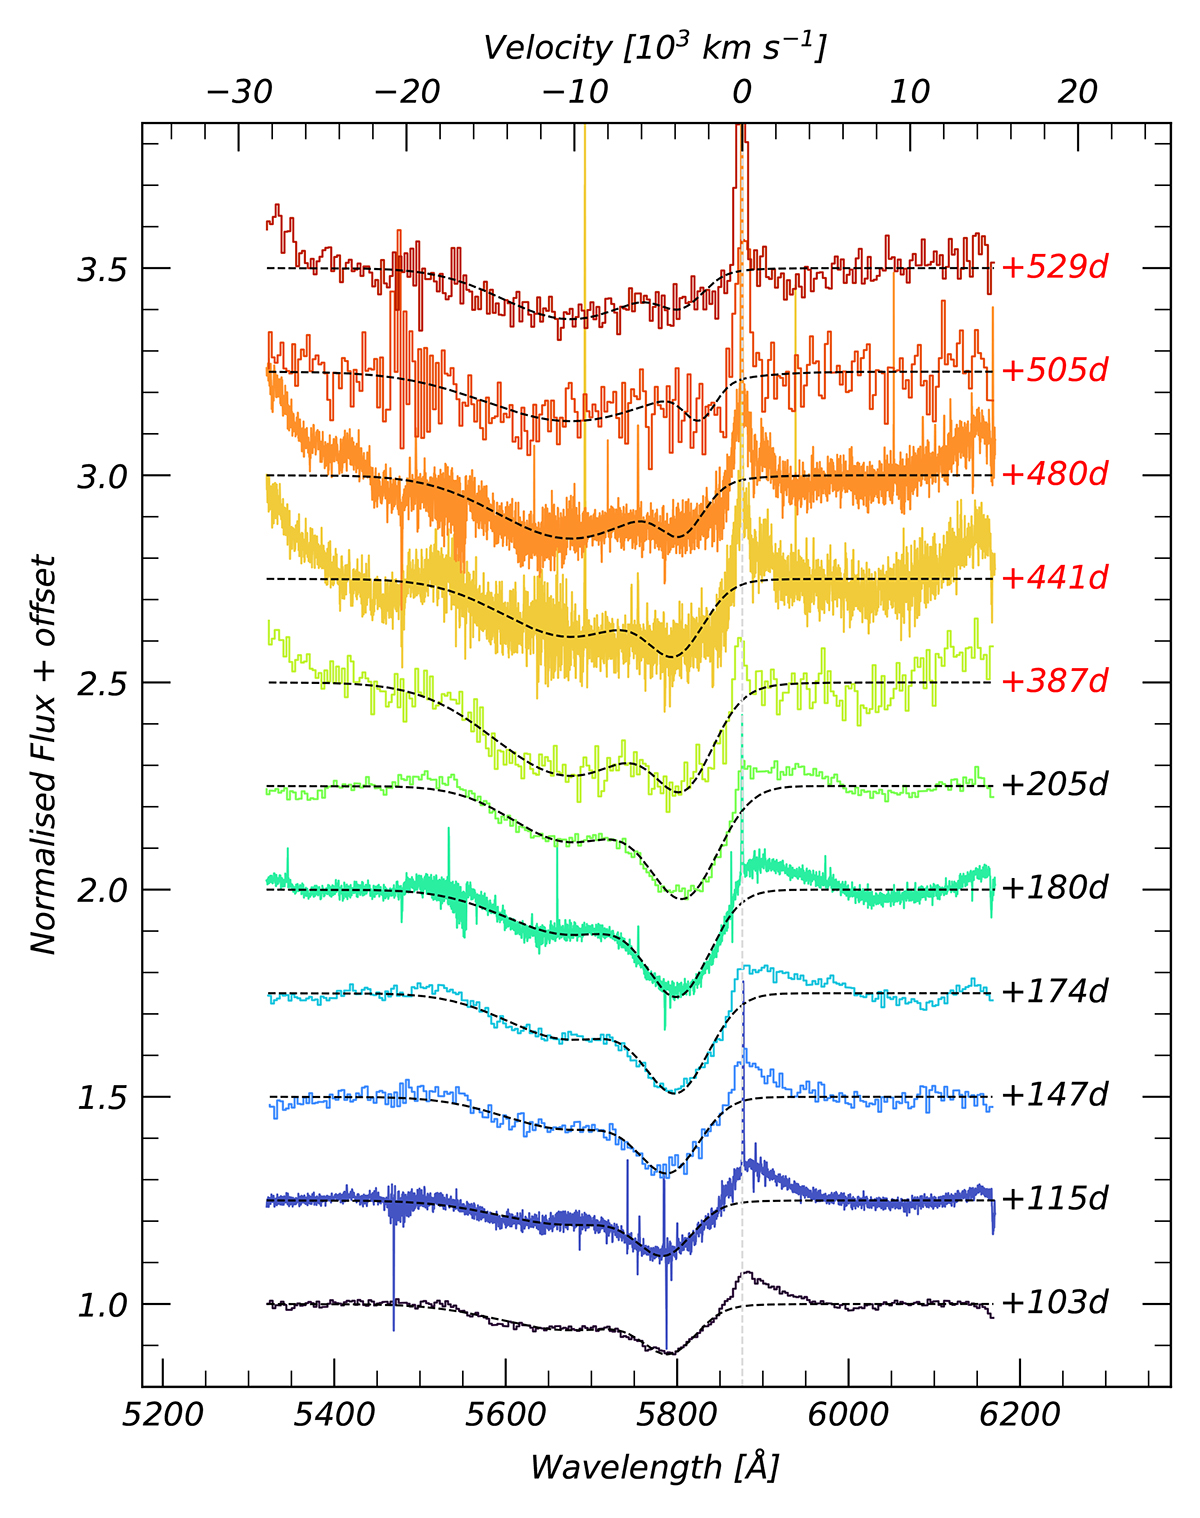
Fig. 14.
Download original image
Evolution of He Iλ5876 line. Each profile is continuum-subtracted. A double-Gaussian absorption profile is fitted to the blue side of each spectrum, and is given by the dashed black line. We do not attempt to include the components in emission, but the emission feature at rest wavelength narrows with time.
Current usage metrics show cumulative count of Article Views (full-text article views including HTML views, PDF and ePub downloads, according to the available data) and Abstracts Views on Vision4Press platform.
Data correspond to usage on the plateform after 2015. The current usage metrics is available 48-96 hours after online publication and is updated daily on week days.
Initial download of the metrics may take a while.