Open Access
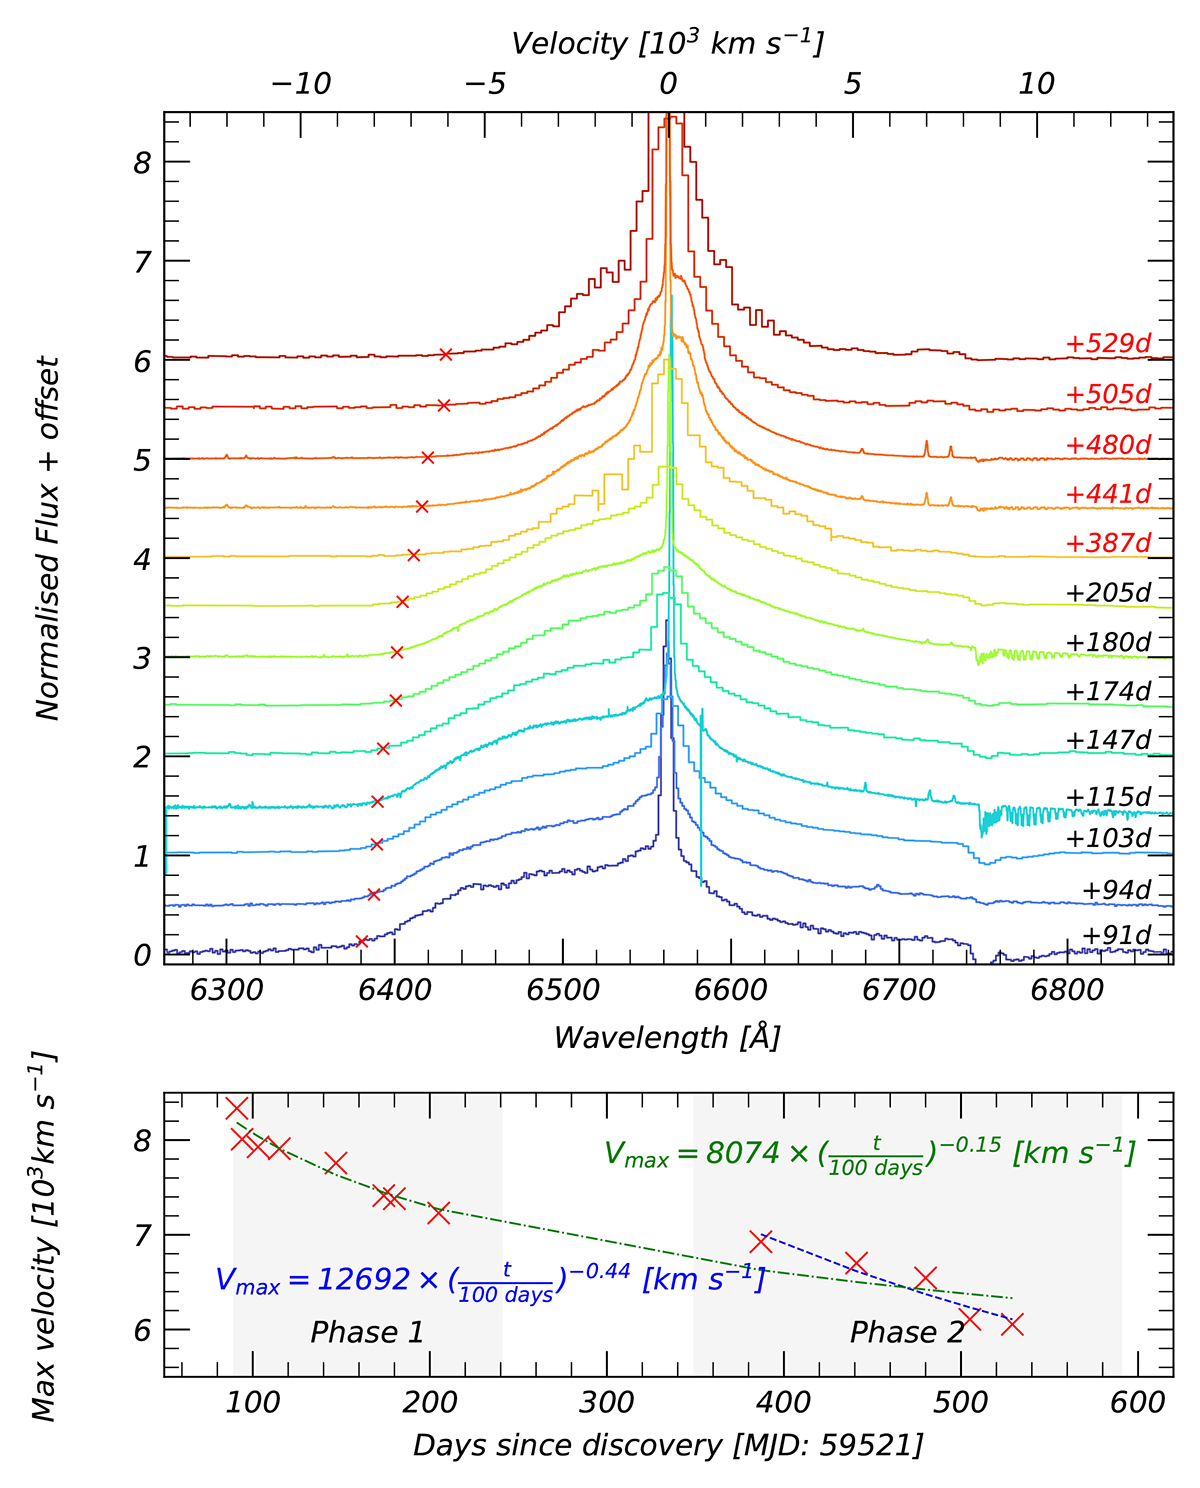
Fig. 12.
Download original image
Same as Fig. 11, but including the complete optical spectral dataset (excluding those from the P60/SEDM). A red cross in each profile denotes the maximum velocity of the blue excess for each spectrum. The lower panel gives the velocity of the bluest edge of the Hα profile, marked by the red cross in the upper panel.
Current usage metrics show cumulative count of Article Views (full-text article views including HTML views, PDF and ePub downloads, according to the available data) and Abstracts Views on Vision4Press platform.
Data correspond to usage on the plateform after 2015. The current usage metrics is available 48-96 hours after online publication and is updated daily on week days.
Initial download of the metrics may take a while.