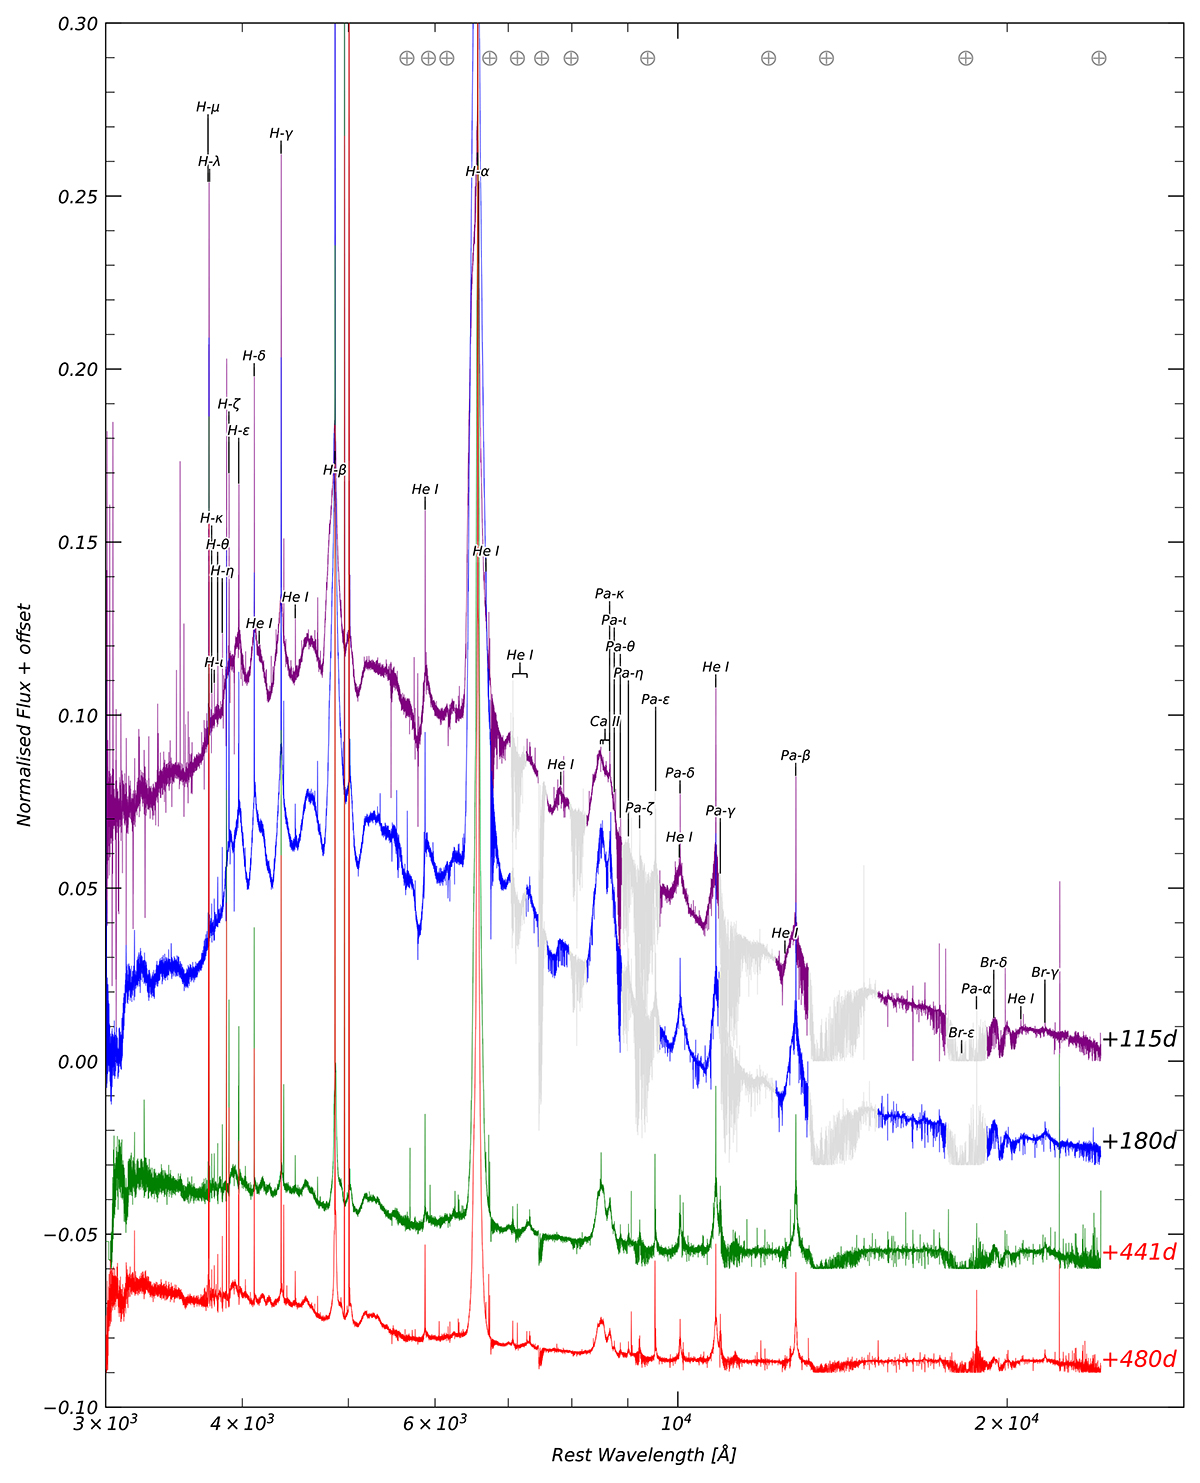
Fig. 10.
Download original image
VLT + X-shooter for SN 2021adxl taken at four different epochs. Each spectrum has been normalized with respect to Hα and offset for clarity. Emission lines expected from the transient (black) are denoted by the vertical lines. Telluric absorption bands arising from atmospheric O2 and H2O are denoted by the ⊕ symbol. We shade in regions of high noise levels from our first two spectra for visual clarity.
Current usage metrics show cumulative count of Article Views (full-text article views including HTML views, PDF and ePub downloads, according to the available data) and Abstracts Views on Vision4Press platform.
Data correspond to usage on the plateform after 2015. The current usage metrics is available 48-96 hours after online publication and is updated daily on week days.
Initial download of the metrics may take a while.