Fig. 7
Download original image
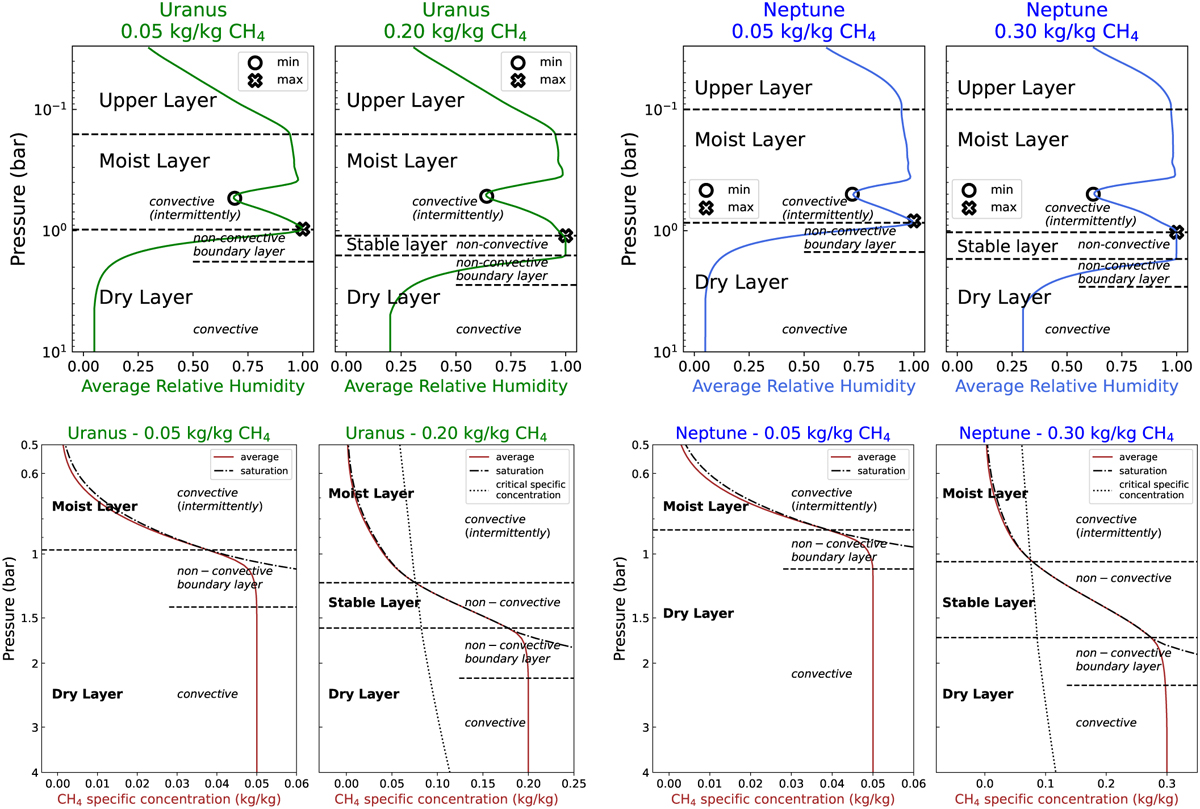
Average structures observed in Uranus and Neptune simulations. First line: average relative humidity in Uranus and Neptune simulations. The markers (O) and (X) indicate the minimum and maximum relative humidity levels in the moist layer, which are studied in Sect. 5. Second line: zoom between 0.5 bar and 4 bar. Methane specific concentration is plotted with a linear scale (instead of log-scale as before). A three-layer structure appears for all simulations with a “Dry Layer” (dry troposphere), a “Moist Layer” (moist troposphere), and an “Upper Layer” (bottom of the stratosphere). A fourth “Stable Layer” appears when the methane abundance in the deep atmosphere exceeds the critical specific concentration. The analytical criteria explain the convective and non-convective parts of these layers. The zoom (bottom panels of Fig. 7) highlights the methane gradient that exists in the upper part of the dry layer just below condensation level and that forms a “non-convective boundary layer”. On the panels of zoom plots where qdeep = 0.05 kg/kg, we do not see the critical specific concentration because the plotted range is lower than it.
Current usage metrics show cumulative count of Article Views (full-text article views including HTML views, PDF and ePub downloads, according to the available data) and Abstracts Views on Vision4Press platform.
Data correspond to usage on the plateform after 2015. The current usage metrics is available 48-96 hours after online publication and is updated daily on week days.
Initial download of the metrics may take a while.