Fig. 5
Download original image
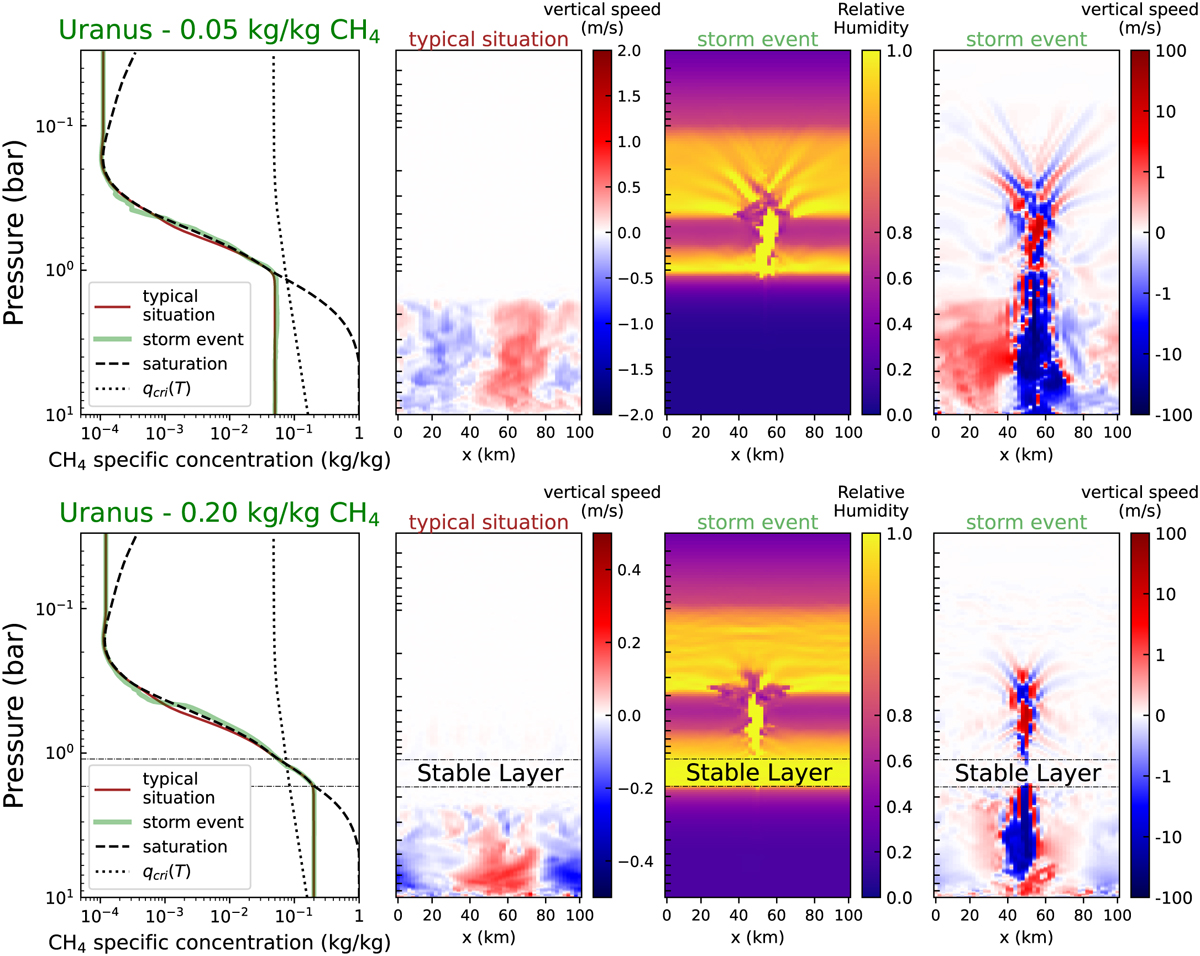
Uranus – synthesis of simulations. Simulations with 0.05 kg/kg methane (∼0.8% methane in number) and 0.20 kg/kg methane (∼3.6% methane in number) in the deep atmosphere are presented. The first plot shows methane specific concentration averaged over the domain for the “typical situation” profile and taken at a given column of the model for the “storm event” profile. For the speed color map of the “typical situation”, we chose an arbitrary snapshot that illustrates well what the typical situation looks like. This typical situation is sometimes perturbed: a convective storm occurs and the atmosphere has the storm event structure. For the color map of the storm event structure, we chose an arbitrary snapshot of a convective storm among the ones occurring during the whole simulation. On the fourth panel, the color bar for the vertical speed is linear in the range [−1,1] and becomes logarithmic in the ranges [−100,−1] and [1,100].
Current usage metrics show cumulative count of Article Views (full-text article views including HTML views, PDF and ePub downloads, according to the available data) and Abstracts Views on Vision4Press platform.
Data correspond to usage on the plateform after 2015. The current usage metrics is available 48-96 hours after online publication and is updated daily on week days.
Initial download of the metrics may take a while.