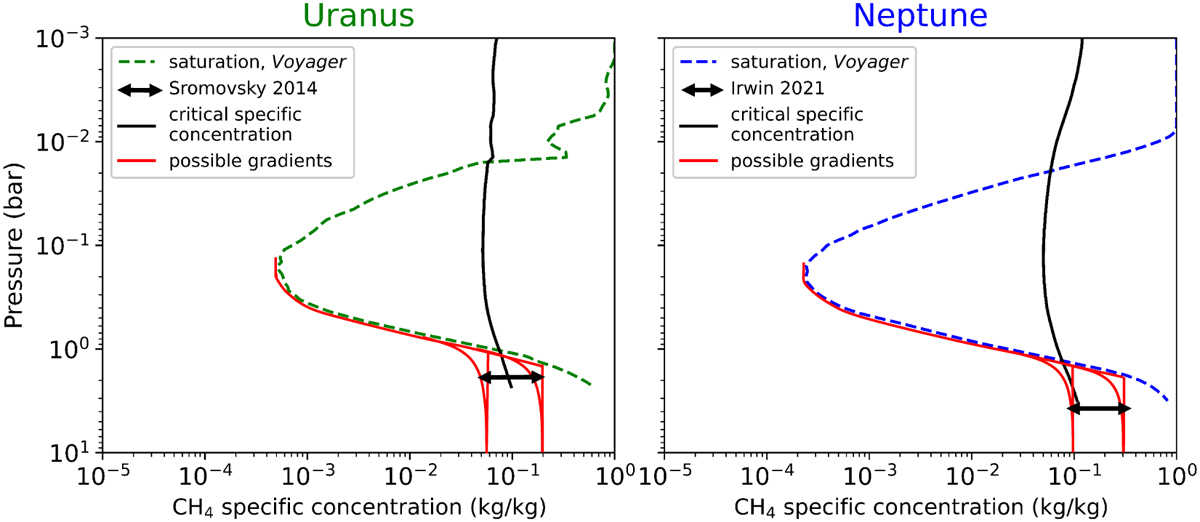
Fig. 2
Download original image
Possible methane vapor profiles in ice giants. In red we plot several possible methane vapor profiles constrained by observations from Sromovsky et al. (2014) and Irwin et al. (2021) (we plot the range of the latitudinal variations) and by saturation curves corresponding to Voyager 2 temperature profiles. Criterion curves in black indicate when moist convection is inhibited: when the specific concentration is higher than the critical specific concentration and the level is saturated, then the criterion applies. These possible methane vapor profiles are inspired by the tested profiles in Sromovsky et al. (2019) who talk about “descended profiles”.
Current usage metrics show cumulative count of Article Views (full-text article views including HTML views, PDF and ePub downloads, according to the available data) and Abstracts Views on Vision4Press platform.
Data correspond to usage on the plateform after 2015. The current usage metrics is available 48-96 hours after online publication and is updated daily on week days.
Initial download of the metrics may take a while.