Fig. 13
Download original image
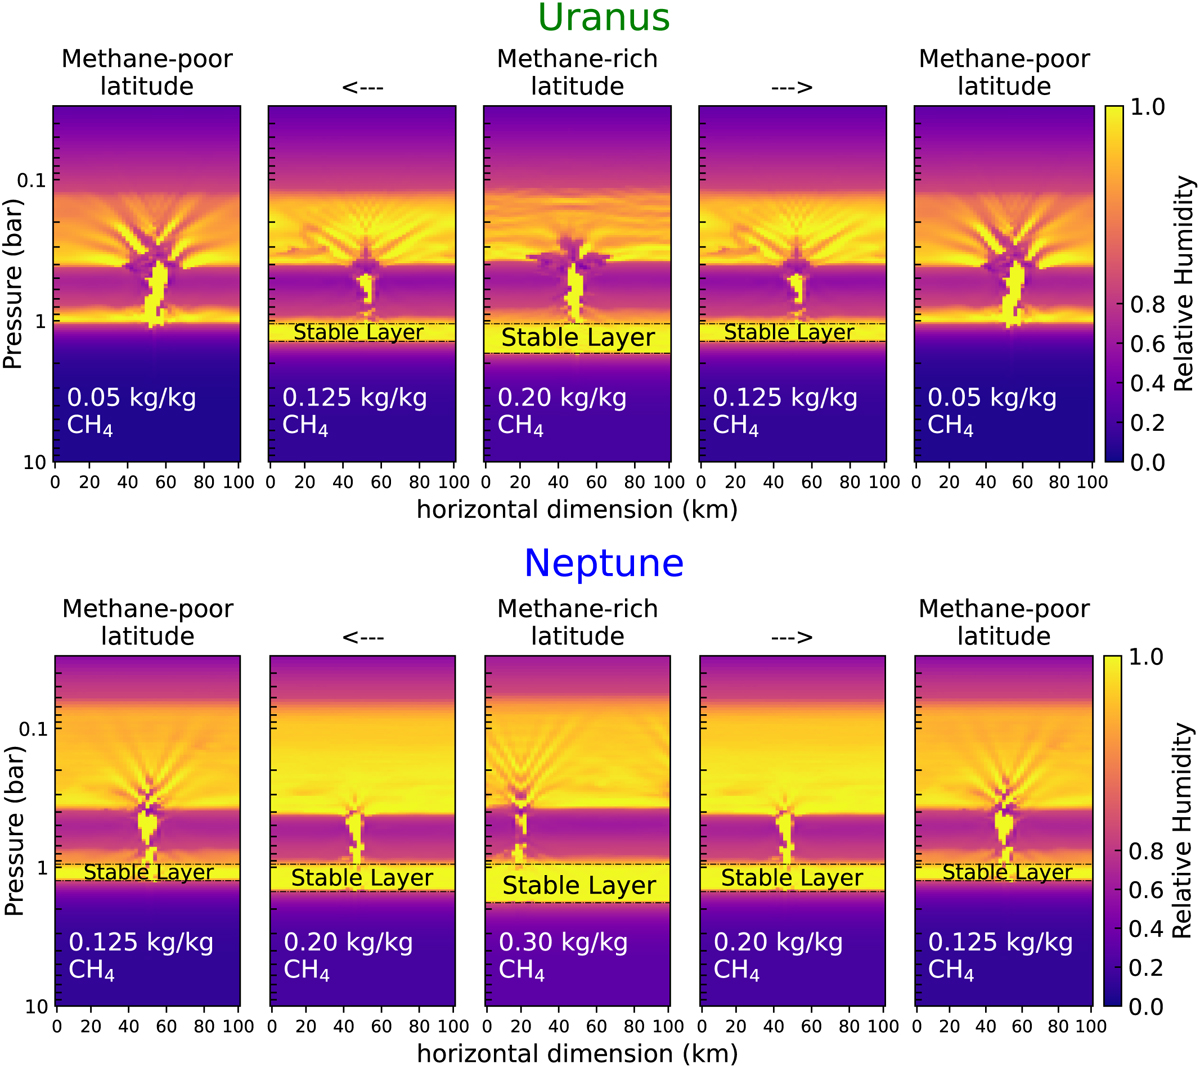
Relative humidity (slices of one horizontal dimension) during convective storms, from methane-rich latitudes to methane-poor latitudes, taken from our simulations in ice giants and inspired by latitudinal and vertical variations shown by observations. The simulations were run with different theoretical methane concentrations in the deep atmosphere. Uranus: Observations show latitudinal variations of 1–4% in methane at 2 bar (Sromovsky et al. 2019), from pole to equator. The relative humidity is plotted from simulations with three different methane specific concentrations: 0.05, 0.125, and 0.20 kg/kg. These correspond to volume mixing ratios of 0.8, 2.1, and 3.6% respectively. Neptune: Observations show latitudinal variations of 2–6% in methane at 4 bar (Irwin et al. 2021), from pole to equator. The relative humidity is plotted from our simulations with three different methane specific concentrations: 0.125, 0.20, and 0.30 kg/kg. These correspond to volume mixing ratios of 2.1, 3.6, and 6.2% respectively. The simulation with qdeep = 0.05 kg/kg is no longer plotted since this configuration might not exist on Neptune. We see powerful but rare storms at methane-poor latitudes and weak but frequent storms at methane-rich latitudes. The more methane there is, the more frequent storms are, but also the weaker they are. To make these plots, we ran three more short simulations with qdeep = 0.125 kg/kg CH4 in Uranus, qdeep = 0.125 and 0.20 kg/kg CH4 in Neptune, in addition to our simulations already presented and detailed in this article.
Current usage metrics show cumulative count of Article Views (full-text article views including HTML views, PDF and ePub downloads, according to the available data) and Abstracts Views on Vision4Press platform.
Data correspond to usage on the plateform after 2015. The current usage metrics is available 48-96 hours after online publication and is updated daily on week days.
Initial download of the metrics may take a while.